Usage
First, log into Grafana (default user and password with Docker is admin/secret).
Configure a datasource using the SimpleJSON connector. Use http://

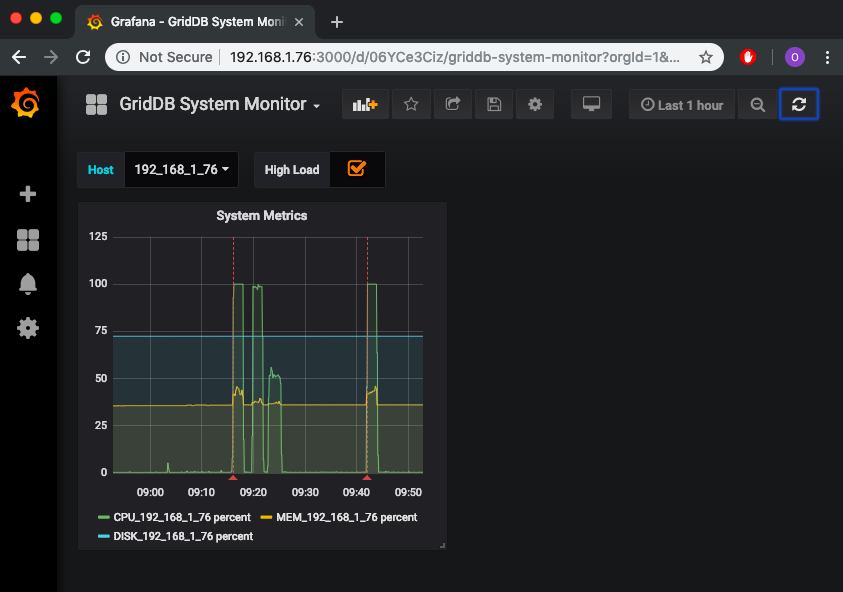
Now create a panel of "Graph" type. Edit the graph and add metrics.
CPU_$host:percent
MEM_$host:percent
DISK_$host:$mount:percent

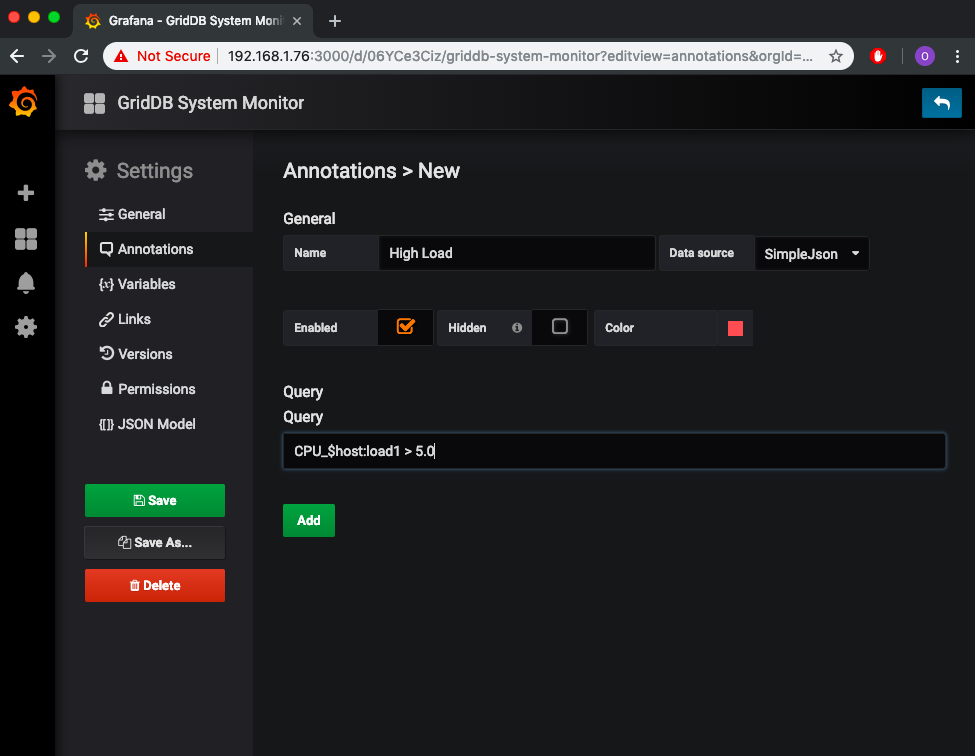
Annotations can be added with a container name and a where clause query as shown below:
