
Introduction
In this tutorial, we will build a 3D motion tracker that can visualize the motion of an object in real time. The motion data is collected from an IMU sensor and Arduino Uno, processed in Node.js and visualized in Babylon.js. The GridDB is used for data storage for future analysis.
Project Source Code
The source code for this project can be found in the following GitHub repository. This project requires hardware and software components.
To run the server, you need to install the dependencies first by running the following command:
cd app/server
npm install
Then run the server using the following command:
npm startThe system will run on the demo version by default using recorded actual sensor data. Go to the URL http://localhost:3000, and the demo data will be fed to the browser every second.
The Arduino source code or sketch can be found in the app/hardware directory. First, you need to program the Arduino Uno. Please read here. Then, to import the necessary libraries, please read the setup the development environment section.
Please note: It would be best to restart the Node.js server every time you plug the Arduino into a new USB port, as the server cannot detect it automatically.
System Architecture
![]()
The architecture illustrates a real-time 3D tracking system involving hardware interfacing and data management. An Arduino Uno with an MPU-9250 sensor collects motion data and sends it to a Node.js server via a serial port connection. Node.js processes the data, performing tasks such as filtering, parsing, and real-time communication. It then interfaces with GridDB, a database used for storing and analyzing the data.
Additionally, Node.js serves as a front-end displaying a 3D cube, which represents the real-time orientation captured by the MPU-9250 sensor. This frontend is a web application that visualizes the sensor data in real-time.
Hardware Requirements
IMU sensor
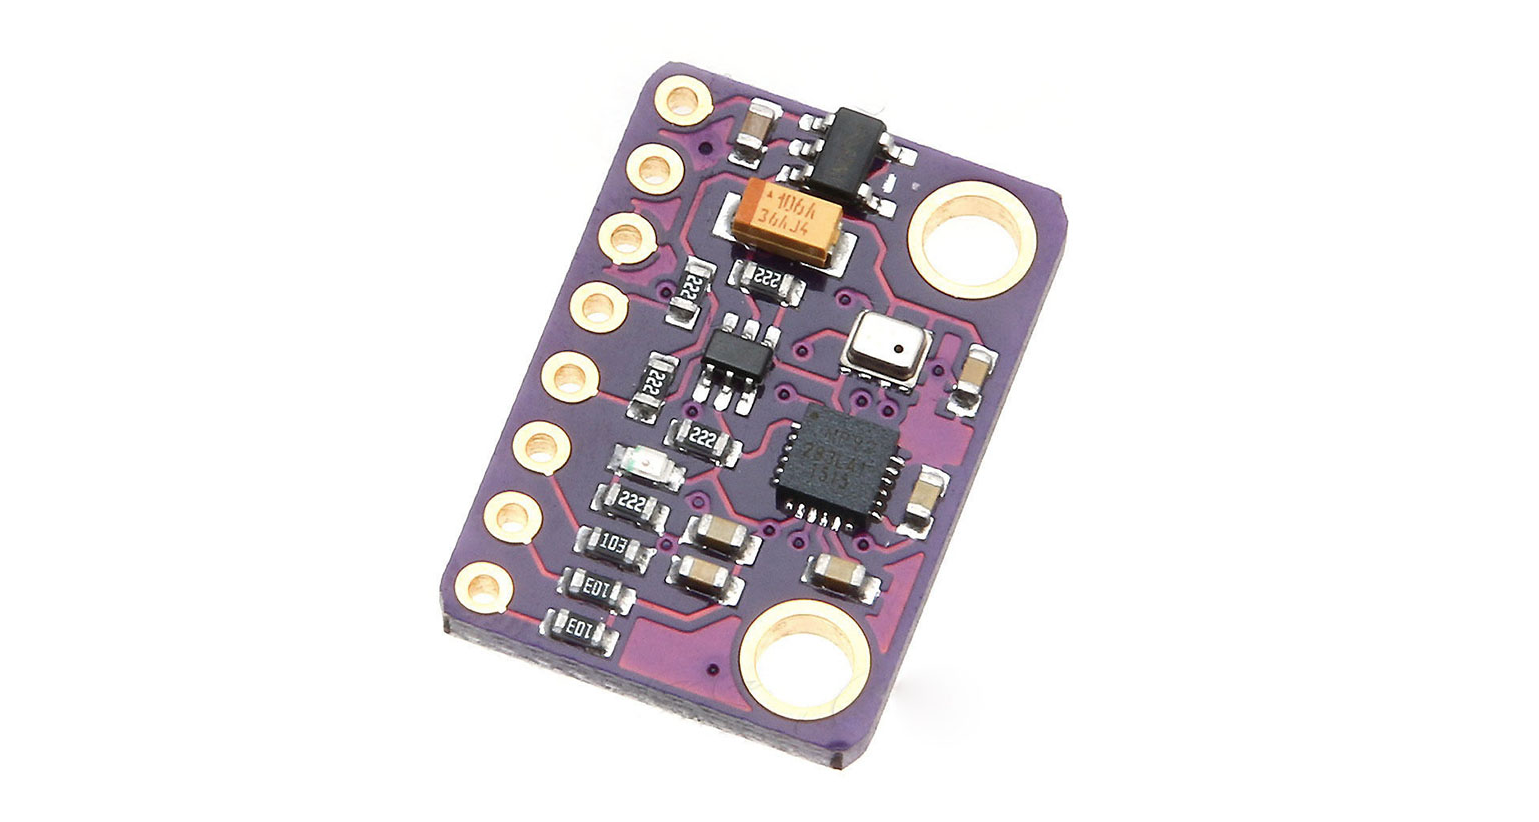
An IMU sensor, or Inertial Measurement Unit sensor, is a device that measures the motion, orientation, and environmental conditions of an object. It consists of an accelerometer, gyroscope, and magnetometer. The accelerometer measures the acceleration of the object, the gyroscope measures the angular velocity, and the magnetometer measures the magnetic field. The IMU sensor used in this project is the MPU-9250. We will use the GY-91 module that contains the MPU-9250 sensor.
Arduino board
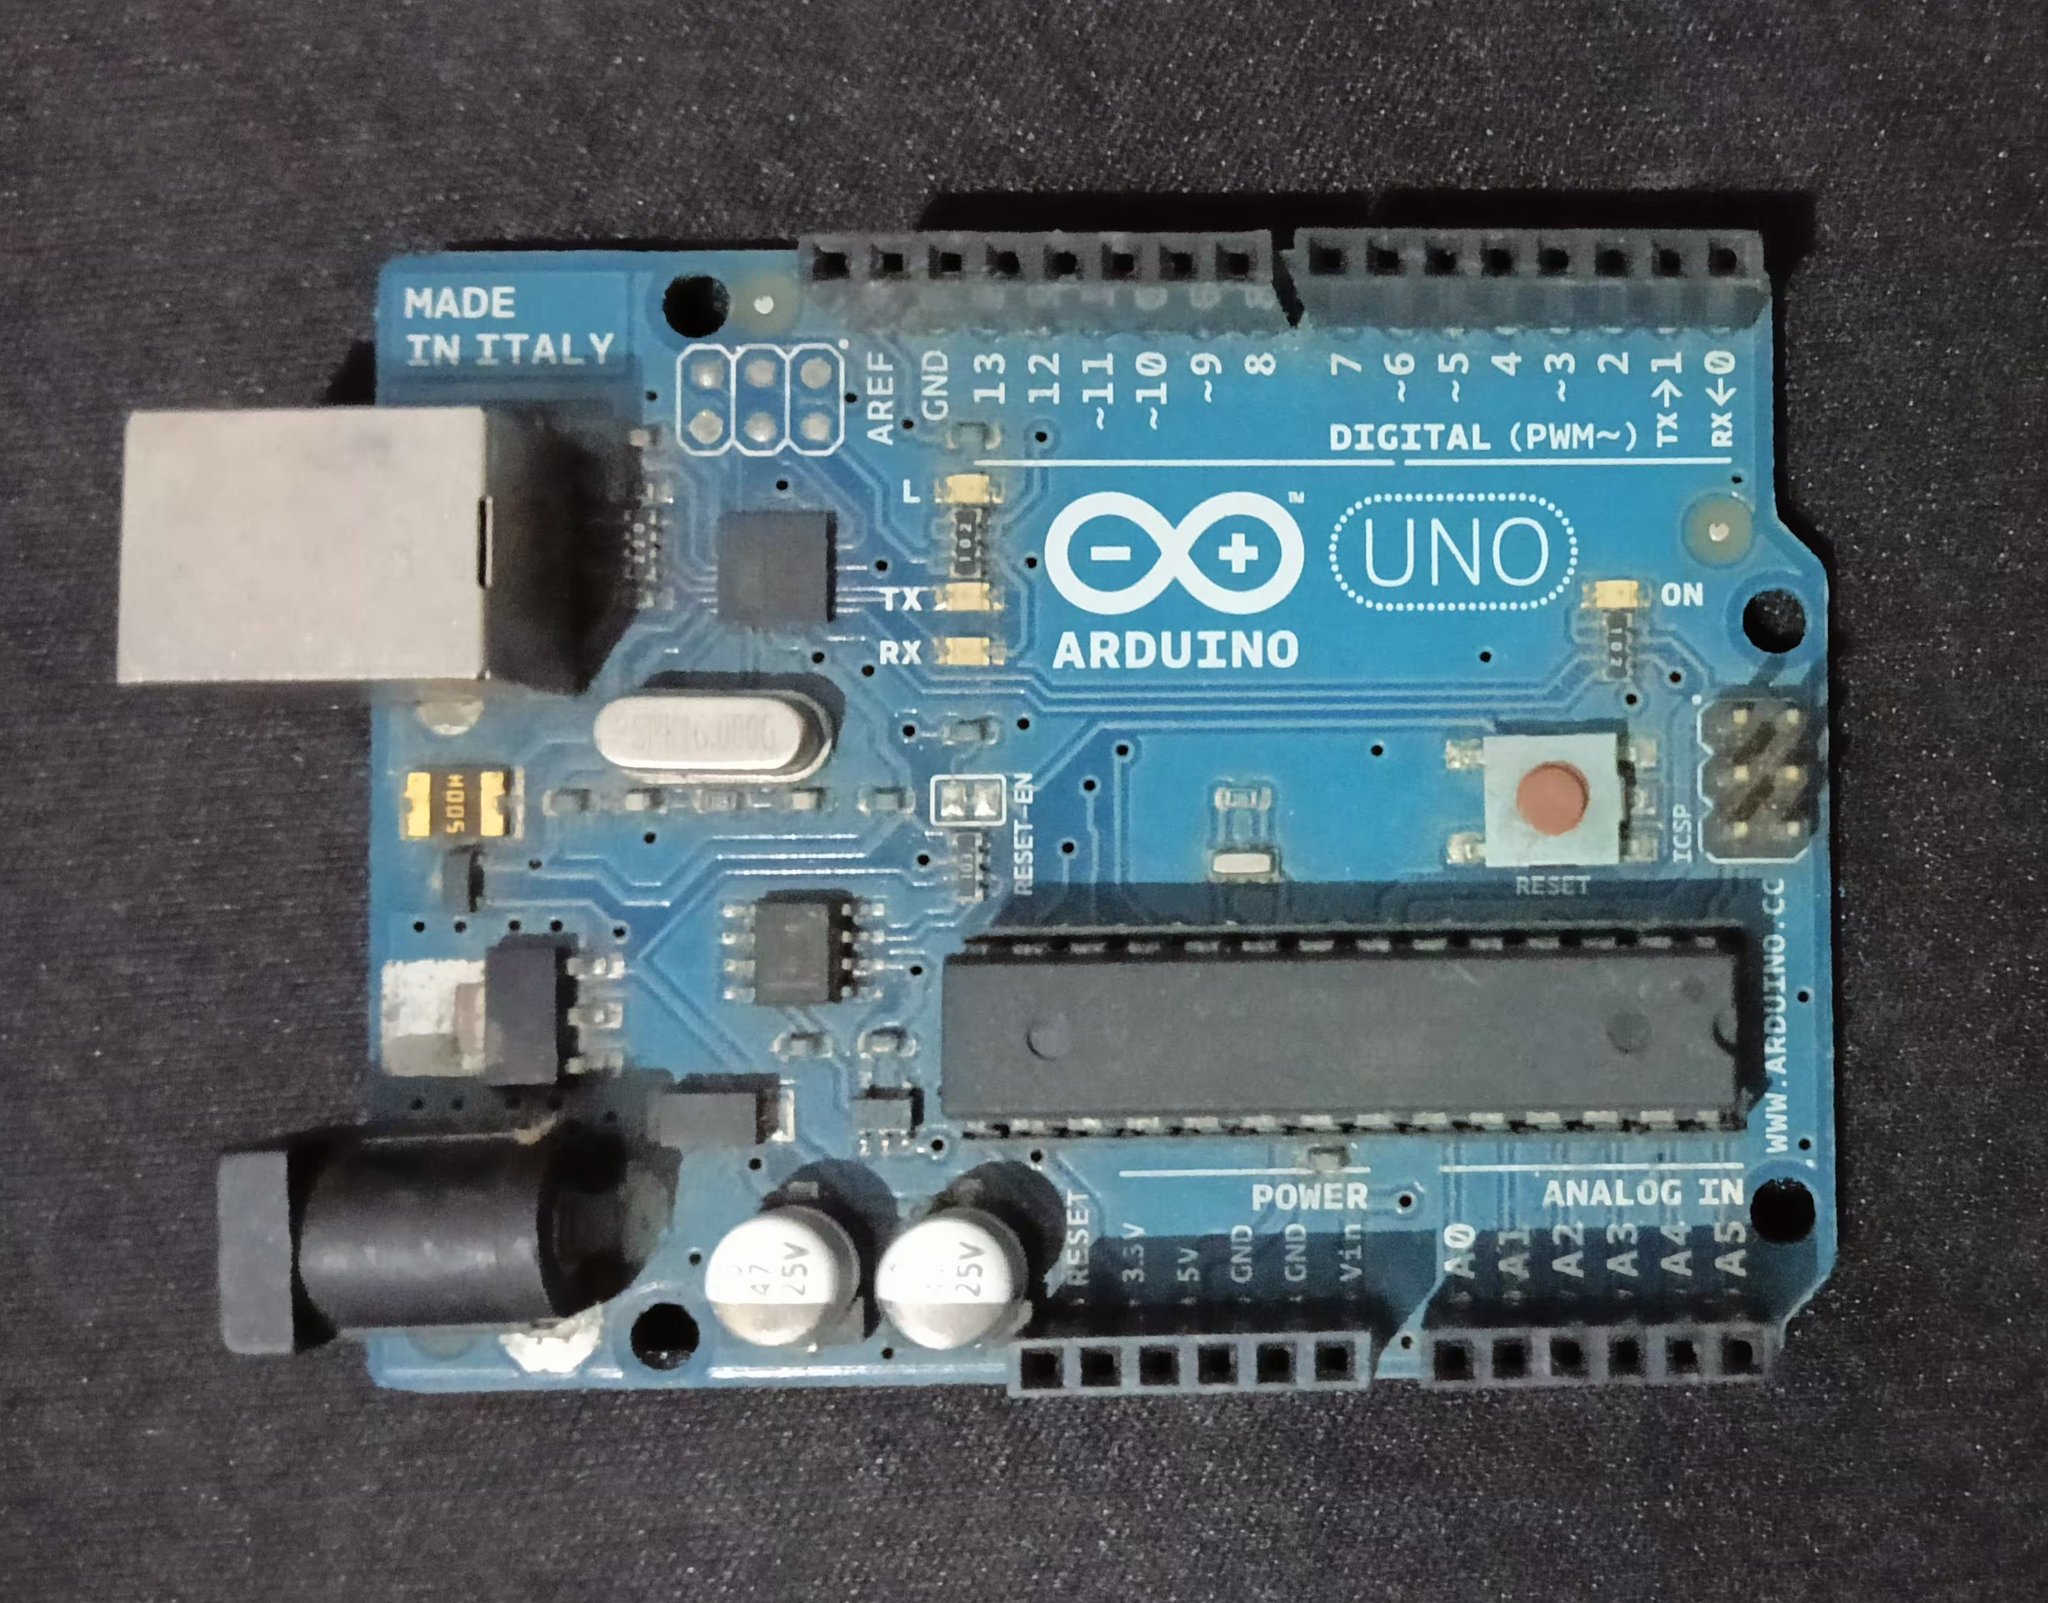
In this project, we use Arduino Uno to read the sensor data from the IMU sensor. The Arduino Uno is a microcontroller board based on the ATmega328P. It has 14 digital input/output pins, 6 analog inputs, a 16 MHz quartz crystal, a USB connection, a power jack, an ICSP header, and a reset button.
Software Requirements
These are the main software components used in this project:
Arduino IDE
The Arduino Uno is programmed using the Arduino Software (IDE). Please follow the official guide to install the Arduino IDE on your computer.
Node.js
Node.js is an open-source, cross-platform, JavaScript runtime environment that executes JavaScript code outside a web browser. It is used to build scalable network applications. Please follow the official guide to install Node.js on your computer.
Node.js is used as a server to process the motion data from the IMU sensor, store to database and send it to the web browser.
GridDB
GridDB is an open-source, in-memory NoSQL database for IoT and big data applications. It is optimized for time-series data and geospatial data. Please follow the official guide to install GridDB on your computer.
GridDB is used to store the motion data from the IMU sensor for future analysis.
Initial Setup Instructions
Setting up the hardware
These are the Bill of Materials (BOM) for this project:
| Item | Quantity | Description |
|---|---|---|
| Arduino Uno Board | 1 | Microcontroller platform for the project. |
| GY-91 IMU Sensor Module | 1 | Provides inertial measurement data. |
| USB Cable | 1 | Connects Arduino to a computer for power and programming. |
| Jumper Wires | 4 | 2 for power, 2 for I2C communication. |
| Breadboard | 1 | Platform for prototyping and testing circuits. |
Depending on your IMU sensor module, you may need to solder header pins to the module. You’ll need a soldering iron and lead or lead-free solder for this task.
There is no need to provide stand-alone power supply because the IMU sensor module and Arduino Uno will be powered by the USB cable from the computer. The interconnection between the IMU sensor module and Arduino Uno will be done using the jumper wires.
Setting up the development environment
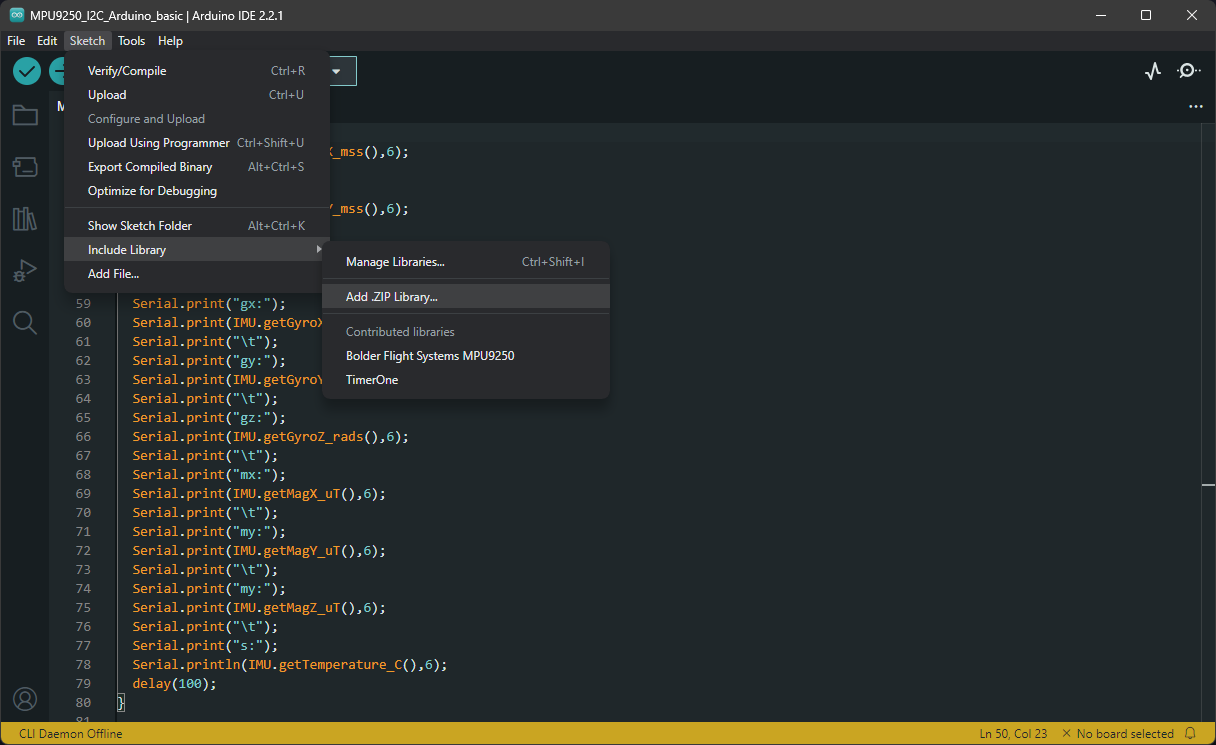
Open the Arduino IDE and import the MPU9250.zip library package into the IDE. The package can be downloaded from here.
To import the library, go to Sketch > Include Library > Add ZIP Library... and select the MPU9250.zip file.
IMU and Arduino Integration
Connecting the IMU sensor with Arduino
The IMU sensor is connected to the Arduino Uno using the I2C interface. The device interconnection is shown in the following diagram:
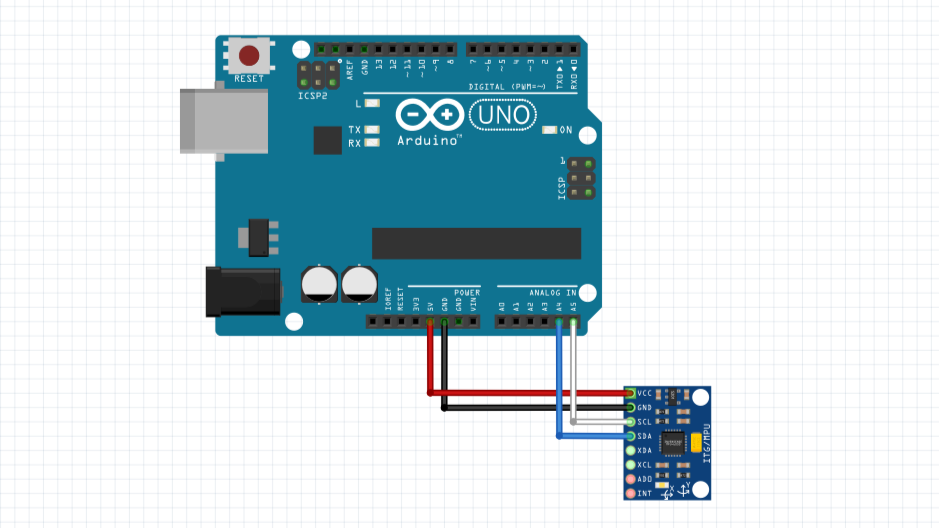
The connections are as follows:
| Arduino Uno Pin | GY-91 IMU Sensor Pin |
|---|---|
| 3.3V | VCC |
| GND | GND |
| A4 (SDA) | SDA |
| A5 (SCL) | SCL |
To program the Arduino Uno, you need to connect it to the computer using the USB cable.
Reading sensor data using Arduino
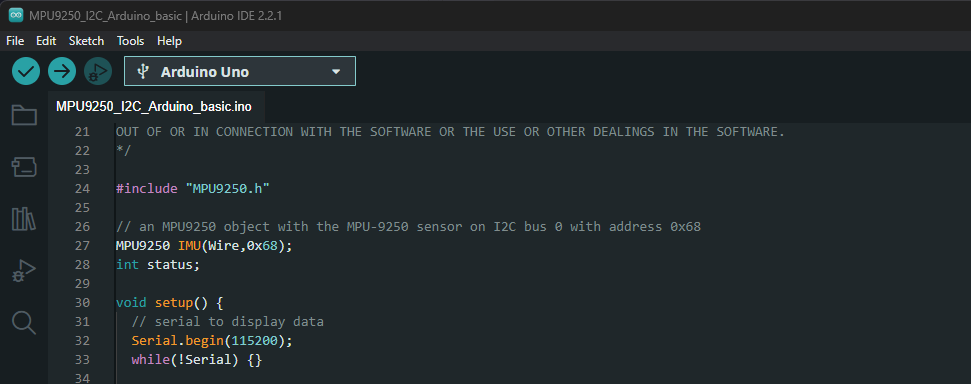
To read sensor data using Arduino, we need to program the Arduino first. Create a new sketch, then copy and paste the following code into the sketch:
#include "MPU9250.h"

// an MPU9250 object with the MPU-9250 sensor on I2C bus 0 with address 0x68
MPU9250 IMU(Wire,0x68);
int status;

void setup() {
  // serial to display data
  Serial.begin(115200);
  while(!Serial) {}

  // start communication with IMU
  status = IMU.begin();
  if (status < 0) {
    Serial.println("IMU initialization unsuccessful");
    Serial.println("Check IMU wiring or try cycling power");
    Serial.print("Status: ");
    Serial.println(status);
    while(1) {}
  }
}

void loop() {
  // read the sensor
  IMU.readSensor();
  // display the data
  Serial.print("ax:");
  Serial.print(IMU.getAccelX_mss(),6);
  Serial.print("t");
  Serial.print("ay:");
  Serial.print(IMU.getAccelY_mss(),6);
  Serial.print("t");
  Serial.print("az:");
  Serial.print(IMU.getAccelZ_mss(),6);
  Serial.print("t");
  Serial.print("gx:");
  Serial.print(IMU.getGyroX_rads(),6);
  Serial.print("t");
  Serial.print("gy:");
  Serial.print(IMU.getGyroY_rads(),6);
  Serial.print("t");
  Serial.print("gz:");
  Serial.print(IMU.getGyroZ_rads(),6);
  Serial.print("t");
  Serial.print("mx:");
  Serial.print(IMU.getMagX_uT(),6);
  Serial.print("t");
  Serial.print("my:");
  Serial.print(IMU.getMagY_uT(),6);
  Serial.print("t");
  Serial.print("my:");
  Serial.print(IMU.getMagZ_uT(),6);
  Serial.print("t");
  Serial.print("s:");
  Serial.println(IMU.getTemperature_C(),6);
  delay(100);
}
The code tells us to read the sensor data via the I2C bus (Wire) at address 0x68 for every 100 milliseconds. The data is sent to the serial port at a baud rate of 115200and it is in the form of a comma-separated string. The first 9 values are the accelerometer, gyroscope, and magnetometer data. The last value is the temperature in Celsius.
Upload Sketch to Arduino
To program the Arduino Uno, upload the sketch by clicking the Upload button at the top left corner of the Arduino IDE (Arrow icon).
![]()
It is recommended that you verify the sketch program before uploading it to the Arduino Uno. You can verify the sketch by clicking the tick mark icon.
Monitor Sensor Data
Open the serial monitor to see the sensor data. The serial monitor can be opened by clicking the magnifying glass icon on the top right corner of the Arduino IDE.
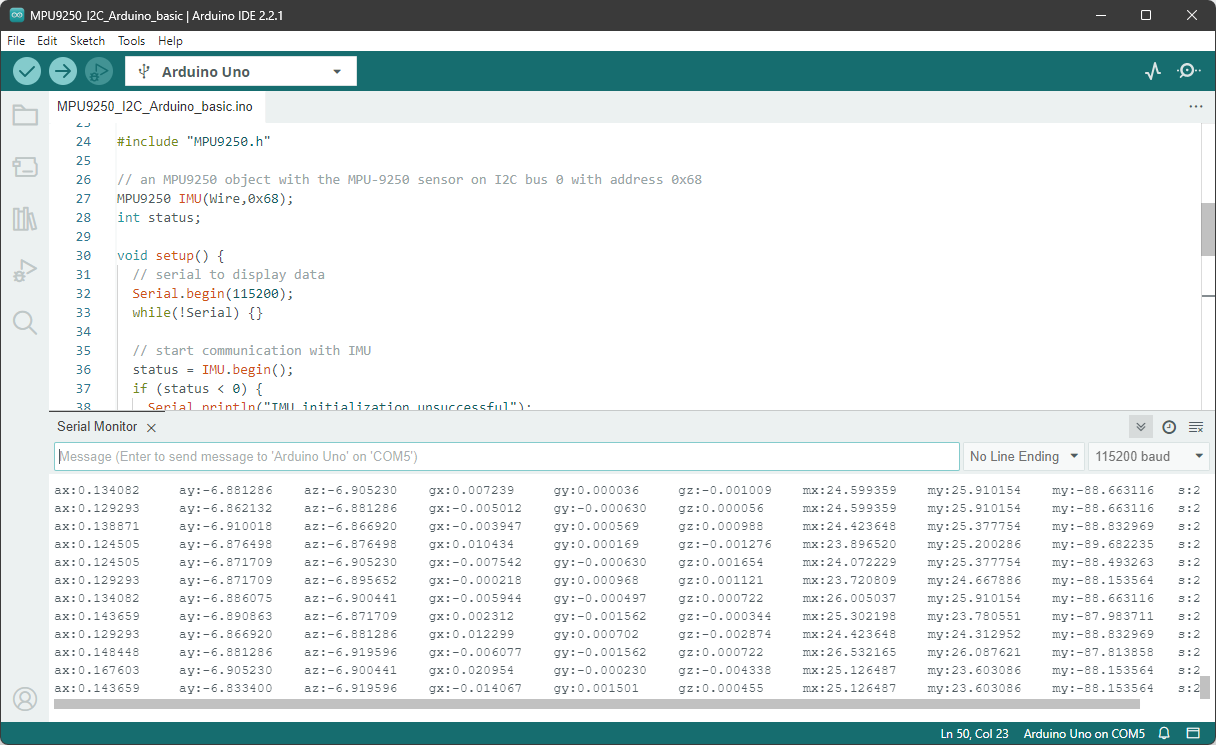
In the serial monitor, you should see the sensor data in the following format:
ax:0 ay:0 az:-9.1 gx:0 gy:0 gz:0 mx:13.0 my:57.1 my:-105.3 s:27.4You can also use CLI serial communication tools such as minicom to read the sensor data.
Using Ubuntu Linux, you can install minicom using the following command:
sudo apt install minicomThen run the following command to read the sensor data:
minicom -D /dev/ttyACM0 -b 115200Just make sure to close the Arduino IDE serial monitor before running the command above.
Node.js and WebSocket Integration
Read sensor data from Arduino
Node.js reads the sensor data from the Arduino Uno via the serial port. In this project, we use the serialport library to read the data.
import { SerialPort } from 'serialport';
import { ReadlineParser } from '@serialport/parser-readline';
import { saveData, getAllData, getDatabyID, info } from './griddbservices.js';

// Serial port setup
const port = new SerialPort({ path: 'COM5', baudRate: 115200 });
const parser = port.pipe(new ReadlineParser({ delimiter: 'n' }));

parser.on('data', (data) => {
 console.log(data);
 const parsedData = parseSensorData(data);
 await saveData({ sensorData: JSON.stringify(parsedData) });
 broadcastData(JSON.stringify(parsedData));
});
The data is then broadcasted to the web browser via WebSocket and also stored in GridDB for future analysis.
await saveData({ sensorData: JSON.stringify(parsedData) });As previously mentioned, you need to close the existing serial port connection, such as the Arduino IDE serial monitor or any program that uses the serial port, such as minicom, so the Node.js server will be able to read the sensor data.
Websocket
WebSocket is a communication protocol that provides full-duplex communication channels over a single TCP connection. It is used in this project to send the sensor data from Node.js to the web browser in real-time. We use the ws library to implement the WebSocket server in Node.js.
import express from 'express';
import { createServer } from 'http';
import { WebSocketServer, WebSocket } from 'ws';

const app = express();
const server = createServer(app);
const wss = new WebSocketServer({ server });

wss.on('connection', (ws) => {
  console.log('WebSocket client connected');
  ws.on('close', () => console.log('WebSocket client disconnected'));
});

const broadcastData = (data) => {
 wss.clients.forEach((client) => {
  if (client.readyState === WebSocket.OPEN) {
   client.send(data);
  }
 });
};
Processing and Visualizing Data
Data Processing
The data is parsed and then processed for adjusting the coordinate system and converting the units. Make sure to read the sensor data sheet before to understand the units of the sensor data.
function parseSensorData(data) {
 // Parse the data string
 const sensorValues = data.split('t').map(val => parseFloat(val.split(':')[1]));

 // The order of the data is ax, ay, az, gx, gy, gz, mx, my, mz
 const [ax, ay, az, gx, gy, gz, mx, my, mz, s] = sensorValues;

 // Normalize accelerometer data if needed (currently in m/s², convert to g's if necessary)
 const accel = {
  x: ax / 1000,
  y: ay / 1000,
  z: az / 1000
 };

 // Gyroscope data is in rad/s, which is what the Madgwick filter expects, so no conversion needed
 const gyro = { x: gx, y: gy, z: gz };

 // Magnetometer data is in microteslas (uT), convert to Teslas by dividing by 1,000,000 if necessary
 const mag = {
  x: mx / 1000000,
  y: my / 1000000,
  z: mz / 1000000
 };

 const temp = { s }

 return { accel, gyro, mag, s };
}
This parsed data is then sent to the web browser via WebSocket.
Visualizing with Babylon.js
To visualize the motion data, we use Babylon.js, a JavaScript framework for building 3D games and applications with WebGL and WebVR. The HTML is as follows:
<!DOCTYPE html>
<html>
<head>
    <meta charset="utf-8" />
    <title>3D Sensor Visualization</title>
    <script src="https://cdn.babylonjs.com/babylon.js"></script>
    <style>
        #renderCanvas {
            width: 100%;
            height: 100vh;
            touch-action: none;
        }
    </style>
</head>

<body>
    <canvas id="renderCanvas"></canvas>
    <script>
        window.addEventListener('DOMContentLoaded', () => {
            const canvas = document.getElementById('renderCanvas');
            const engine = new BABYLON.Engine(canvas, true);

            const createScene = () => {
                const scene = new BABYLON.Scene(engine);
                const camera = new BABYLON.ArcRotateCamera("camera", -Math.PI / 2, Math.PI / 2.5, 10, new BABYLON.Vector3(0, 0, 0), scene);
                camera.attachControl(canvas, true);
                new BABYLON.HemisphericLight("light", new BABYLON.Vector3(1, 1, 0), scene);
                const box = BABYLON.MeshBuilder.CreateBox("box", { size: 2 }, scene);
                return { scene, box };
            };

            const { scene, box } = createScene();

            const ws = new WebSocket('ws://localhost:3000');
            ws.onmessage = (event) => {
                const sensorData = JSON.parse(event.data);
                const { gyro } = sensorData;

                // Update cube rotation with gyro data in radians/s
                // Assume you're receiving data at a rate of 60Hz (or adjust as per your rate)
                box.rotation.x += gyro.x / 10; // Update rotation based on gyro data
                box.rotation.y += gyro.y / 10;
                box.rotation.z += gyro.z / 10;
            };

            engine.runRenderLoop(() => {
                scene.render();
            });

            window.addEventListener('resize', () => {
                engine.resize();
            });
        });
    </script>
</body>

</html>
The code above creates a scene with a camera, a light, and a box. The box will be rotated based on the gyroscope data from the IMU sensor. The gyroscope data is received via WebSocket from Node.js.
<div align="center">
<img src="images/3D-Tracking-System.gif"/>
<br/>
</div>
By default, the WebSocket URL runs on localhost with the port 3000. You need to change the WebSocket URL to match your Node.js server URL and change the code in this line:
const ws = new WebSocket('ws://localhost:3000');Storing Data with GridDB
The GridDB stores the motion data from the IMU sensor for future analysis. The file app/server/griddbservices.js is a wrapper for libs/griddb.js that contains the GridDB functions.
To save parsed sensor data to GridDB, the code is as follows:
await saveData({ sensorData: JSON.stringify(parsedData) });The data is stored in the form of a JSON string. You can look at the libs/griddb.js file to see how the data is stored in GridDB.
function initContainer() {
const conInfo = new griddb.ContainerInfo({
name: containerName,
columnInfoList: [
['id', griddb.Type.INTEGER],
['data', griddb.Type.STRING],
],
type: griddb.ContainerType.COLLECTION,
rowKey: true,
});
return conInfo;
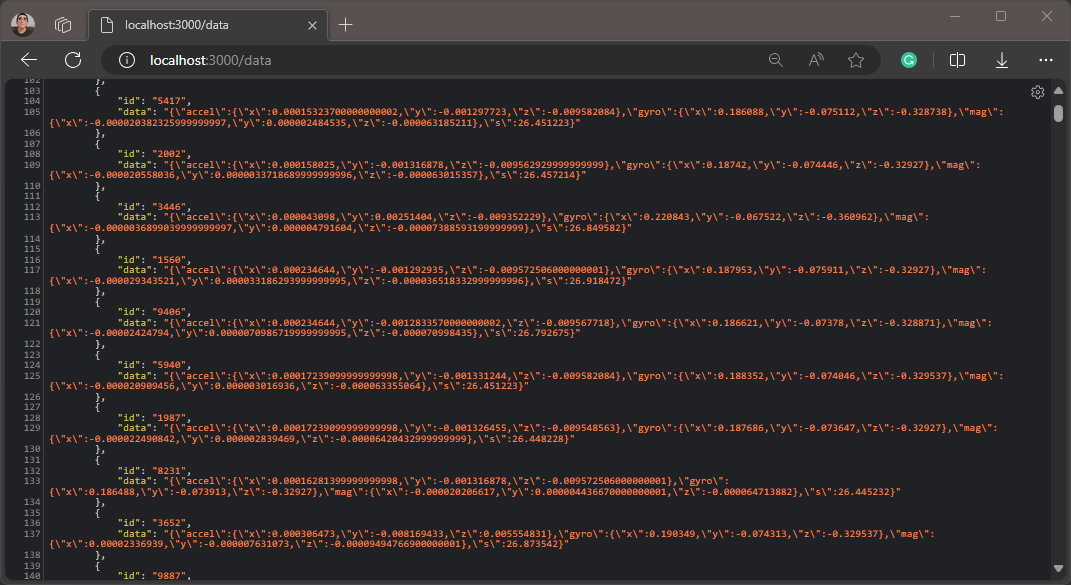
}Data Retrieval from GridDB
To retrieve all data from GridDB, the code is as follows:
app.get('/data', async (req, res) => {
    log.info('Getting all data from GridDB');
    try {
        const result = await getAllData();
        res.json(result);
    } catch (error) {
        res.status(500).send('Error getting all data');
    }
})
You can retrieve the data from the browser by accessing the URL http://localhost:3000/data.
If you have any questions about the blog, please create a Stack Overflow post here https://stackoverflow.com/questions/ask?tags=griddb .
Make sure that you use the “griddb” tag so our engineers can quickly reply to your questions.