
Dataset
In this article, we will take a look at how to analyze a weather forecasting time series dataset with GridDB and Node.js. We will be using the `Jaipur weather forecasting data set` in the tutorial. You can download this public dataset here.
This dataset provides the weather data from 1st of May in 2016 to 11th of March in 2018 of the city Jaipur in India. It contains 40 column attributes that describe the weather. The following grid describes the attributes of the dataset clearly.
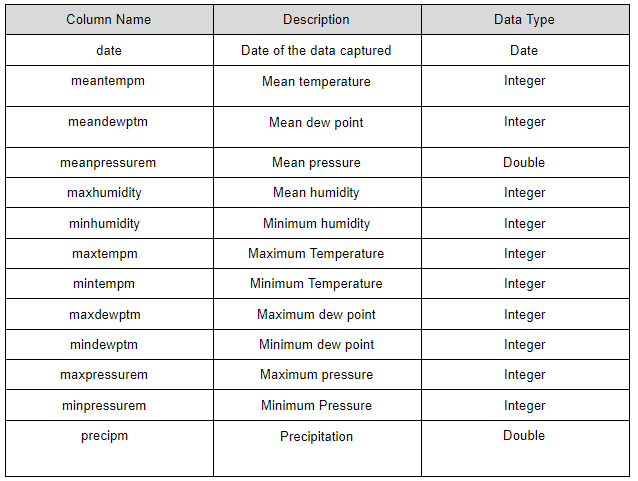
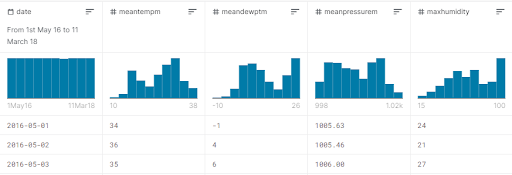
In this tutorial, we will be considering only the date, mean temperature, mean dew point, mean pressure, and
max humidity values. These values that we are going to analyze are shown in the following image.
Before starting implementation, you need to set up the GridDB server with a Node.js client.
Environment Setup
When setting up the Node.js client, you can either build with source as in this blog or use GridDB with Node Package Manager (npm). Here, you can download the GridDB npm package.
In this tutorial, we are not going to focus on the installation steps. Before moving to the next step, make sure you have installed and set up the environments, as mentioned in the given blogs. By now, I hope that you have created a node.js project and installed the GridDB library.
Implementation
Now the first thing you need to do is importing the GridDB library to the program as follows.
const griddb = require(‘griddb_node’);
Then get the grid store by giving the correct hostname, cluster name, username, and password, etc.
const factory = griddb.StoreFactory.getInstance();
        const gridStore = factory.getStore({
            "host": '239.0.0.1',
            "port": 31999,
            "clusterName": "defaultCluster",
            "username": "admin",
            "password": "admin"
        });

Now you can create the containers. For simplicity, we are using one container in this tutorial. However, you can enhance the code and add multiple containers according to the scenario as well.
const colConInfo = new griddb.ContainerInfo({
    'name': "Weather",
    'columnInfoList': [
        ["date", griddb.Type.TIMESTAMP],
        ["meantempm", griddb.Type.STRING],
        ["meandewptm", griddb.Type.INTEGER],
        ["meanpressurem", griddb.Type.DOUBLE],
        ["maxhumidity", griddb.Type.INTEGER],
    ],
    'type': griddb.ContainerType.TIME_SERIES, 'rowKey': true
});
In this code snippet, we have mentioned the name of the container as “Weather” and given the column list that we need to store in the database. Among them, the date attribute’s type is the TIMESTAMP, which is used to mention the timestamp attribute. Meanpressure attribute contains the data in `double` type, and all other attributes that we use in this analysis are `INTEGER` type. From the last line, we have mentioned the type of this GridDB container as TIME_SERIES container.
Inserting data into the database
By now, we have set up the environment and created the container. Then we need to insert the required data columns that need to be analyzed in our dataset. For that, first, we should read the data from a CSV file, which includes our dataset. csv-parser is a module that you can use for reading from CSV and writing to CSV files. Installation of this npm module is done with the following command.
npm i -s csv-parserNow we are going to read the CSV file. I have saved my CSV file, which includes the dataset as “data.csv” . You can use any name as you need. For reading data from the CSV file, you can use the following code snippet. Here “addRowsToDatabase†method has been used to add necessary data to our database.
const csv = require('csv-parser');
const fs = require('fs');

fs.createReadStream('data.csv')
  .pipe(csv())
  .on('data', (row) => {
    addRowsToDatabase(row.date,row.meantempm,row.meandewptm,row.meanpressurerm,row.maxhumidity);
  })
  .on('end', () => {
    console.log('CSV file successfully processed');
  });
In this code, we have created a readStream using the fs module, then pipe it into the CSV object that fires the data event each time a new row from the CSV file is processed. The end event is triggered when all the rows from the CSV file are processed.
The reason why we have sent only the `date`, `meantempm`, `meandewptm`, `meanpressurerm`, `maxhumidity` is because we are going to analyze data only in these particular columns, and it’s not required to store all the columns in the dataset in our database.
The selected rows can be added to GridDB using the “griddb.Container put†method as follows. This is the implementation of “addRowsToDatabase†method.
addRowsToDatabase(date, meantempm, meandewptm, meanpressurerm, maxhumidity){
    var col2;
    Var newDate = convertDateToTimeStamp(date)
    store.putContainer(conInfo, false)
       .then(col => {
            col2 = col;
           col.createIndex("count", griddb.GS_INDEX_FLAG_DEFAULT);
           return col;
        })
       .then(col => {
           col.setAutoCommit(false);
           col.put([newDate, meantempm, meandewptm, meanpressurerm, maxhumidity]);
           return col;
       })
}
In this method, we have taken all the necessary data that is required to store in the database as parameters. Inside the function, we have the “putContainer” method. It is used to save data in the GridDB. This method contains two parameters. The first parameter takes container information `conInfo`.
As you can see in the code, I have used a separate method, `convertDateToTimeStamp` to convert date to `timestamp`. `putContainer` uses JavaScript promises to create indexes and populate columns and data.
Analyzing Data
In the previous step, we saved the necessary data in our database. Now you are ready to query the database and analyze data.
Next, you need to develop a query object to query the database. In GridDB, the query language that is used to access and manipulate data is TQL. After accessing the data, you can fetch the data and save it in another object.
Once the containers have been populated with relevant data, you can query the data. It can be done using the node.js client API by calling the “query†method from the “container object.
var col2;
var newDate = convertDateToTimeStamp(date)
store.putContainer(conInfo, false)
       .then(col => {
               col2 = col;
               col.createIndex("count", griddb.GS_INDEX_FLAG_DEFAULT);
               return col;
       })
       .then(col => {
               col.setAutoCommit(false);
               col.put([newDate, meantempm, meandewptm, meanpressurerm, maxhumidity]);
               return col;
       })
       .then(col => {
               col.commit();
               return col;
       })
       .then(col => {

               query = col.query("select *");
               return query.fetch();
       })
       .then(rs => {

               while (rs.hasNext()) {
                       console.log(rs.next());
               }
               col2.commit();
       })
       .catch(err => {
               console.log(err.what());
               for (var i = 0; i < err.getErrorStackSize(); i++) {
                       console.log("[", i, "]");
                       console.log(err.getErrorCode(i));
                       console.log(err.getMessage(i));
               }
       });
In the above code, we have committed the changes to the database and tested a simple query on database "select *". It selects all the values of the database without applying any conditions. The last part of the code is used to catch the errors if any error occurred.
Now let’s analyze our dataset using several queries.
var timeseries;
store.getContainer("Weather")
.then(ts => {
timeseries = ts;
query = ts.query("select * from Weather where meantemp > 34");
return query.fetch();
})
.then(rowset => {
var row;
while (rowset.hasNext()) {
row = rowset.next();
var timestamp = Date.parse(row[0]);
aggCommand = "select AVG(maxhumidity) from Weather where timestamp > 05012019 00:00:00â€, 10)";
aggQuery = timeseries.query(aggCommand);
aggQuery.fetch()
.then(aggRs => {
while (aggRs.hasNext()) {
aggResult = aggRs.next();
console.log("[Timestamp = " + timestamp + "] Average voltage = "+ aggResult.get(griddb.GS_TYPE_DOUBLE));
}
});
}
})Initially, we have accessed the container "Weather" in this code. In the first part, we have executed the query select * from Weather where `meantemp` > 34. It returns all the rows from the weather container, which contain the mean temperature above 34.
In the second part of the code, we execute an aggregated query.
select AVG(maxhumidity) from Weather where timestamp >05012019 00:00:00)
This retrieves the average maximum humidity, which is recorded in the `timestamp` after the given `timestamp` in the query.
We can generate several kinds of queries such as `select MAX(meanpressurem) from Weather where maxhumidity> 27`, which gives the maximum mean pressure value while having the maximum humidity above 27.
Conclusion
Cool, That's pretty much about it. In this article, we discussed some simple methods on how we can analyze the weather forecasting dataset, which was recorded in Jaipur city in India. We used GridDB for manipulating this time series data set. You can add multiple different methods and queries in order to analyze the time-series database like this. You can use these concepts we have used in this tutorial in any related scenario as well.