With the advent of Large Language Models (LLMs), chatbot applications have become increasingly common, enabling more natural and intelligent interactions with data.
In this article, you will see how to build a stock market chatbot using LangGraph, OpenAI API, and GridDB cloud.
We will retrieve historical Apple stock price data from Yahoo Finance using the yfinance library, insert it into a GridDB container, and then query it using a chatbot built with LangGraph that utilizes the OpenAI GPT -4 model.
GridDB is a high-performance time-series database designed for massive real-time workloads. Its support for structured containers, built-in compression, and lightning-fast reads and writes makes it ideal for storing and querying time series data such as stock market prices.
Installing and Importing Required Libraries
!pip install -q yfinance
!pip install langchain
!pip install langchain-core
!pip install langchain-community
!pip install langgraph
!pip install langchain_huggingface
!pip install tabulate
!pip uninstall -y pydantic
!pip install --no-cache-dir "pydantic>=2.11,<3"
import yfinance as yf
import pandas as pd
import json
import datetime as dt
import base64
import requests
import numpy as np
from langchain_core.prompts import ChatPromptTemplate
from langchain_openai import ChatOpenAI
from langchain_core.output_parsers import StrOutputParser
from langgraph.graph import START, END, StateGraph
from langchain_core.messages import HumanMessage
from langgraph.checkpoint.memory import MemorySaver
from langchain_experimental.agents import create_pandas_dataframe_agent
from langchain_openai import OpenAI
from langchain.agents.agent_types import AgentType
from typing_extensions import List, TypedDict
from pydantic import BaseModel, Field
from IPython.display import Image, displayInserting and Retrieving Stock Market Data From GridDB
We will first import data from Yahoo Finance into a Python application. Next, we will insert this data into a GridDB container and will retrieve it.
Importing Data from Yahoo Finance
The yfinance Python library allows you to import data from Yahoo Finance. You need to pass the ticker name, as well as the start and end dates, for the data you want to download.
The following script downloads the Apple stock price data for the year 2024.
import yfinance as yf
import pandas as pd

ticker      = "AAPL"
start_date  = "2024-01-01"
end_date    = "2024-12-31"

dataset = yf.download(ticker, start=start_date, end=end_date, auto_adjust=False)

# ───────────────────────────────────────────────────────────────
# 1. FLATTEN: keep the level that holds 'Close', 'High', …
# ───────────────────────────────────────────────────────────────
if isinstance(dataset.columns, pd.MultiIndex):

    # find the level index where 'Close' lives
    for lvl in range(dataset.columns.nlevels):
        level_vals = dataset.columns.get_level_values(lvl)
        if 'Close' in level_vals:
            dataset.columns = level_vals        # keep that level
            break
else:
    # already flat – nothing to do
    pass

# ───────────────────────────────────────────────────────────────
# 2. Select OHLCV, move index to 'Date'
# ───────────────────────────────────────────────────────────────
dataset = dataset[['Close', 'High', 'Low', 'Open', 'Volume']]
dataset = dataset.reset_index().rename(columns={'index': 'Date'})
dataset['Date'] = pd.to_datetime(dataset['Date'])

# optional: reorder columns
dataset = dataset[['Date', 'Close', 'High', 'Low', 'Open', 'Volume']]
dataset.columns.name = None

dataset.head()
Output:
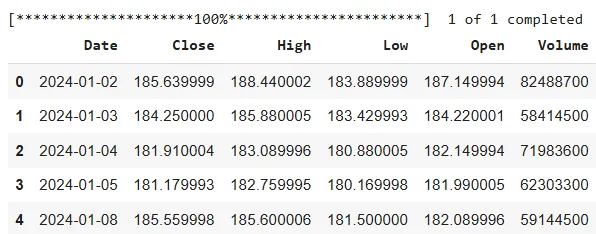
The above output indicates that the dataset comprises the daily closing, opening, high, low, and volume prices for Apple stock.
In the section, you will see how to insert this data into a GridDB cloud container.
Establishing a Connection with GridDB Cloud
After you create your GridDB cloud account and complete configuration settings, you can run the following script to see if you can access your database within a Python application.
username = "your_user_name"
password = "your_password"
base_url = "your_griddb_host_url"

url = f"{base_url}/checkConnection"

credentials = f"{username}:{password}"
encoded_credentials = base64.b64encode(credentials.encode()).decode()

headers = {
    'Content-Type': 'application/json',  # Added this header to specify JSON content
    'Authorization': f'Basic {encoded_credentials}',
    'User-Agent': 'PostmanRuntime/7.29.0'
}

response = requests.get(url, headers=headers)

print(response.status_code)
print(response.text)Output:
200
The above output indicates that you have successfully connected with your GridDB cloud host.
Creating a Container for Inserting Stock Market Data in GridDB Cloud
Next, we will insert the Yahoo Finance into GridDB. To do so, we will add another column, SerialNo which contains unique keys for each data row, as GridDB expects a unique key column in the dataset. Next, we will map Pandas dataframe column types to Gridb data types.
dataset.insert(0, "SerialNo", dataset.index + 1)
dataset['Date'] = pd.to_datetime(dataset['Date']).dt.strftime('%Y-%m-%d')  # "2024-01-02"
dataset.columns.name = None
# Mapping pandas dtypes to GridDB types
type_mapping = {
    "int64":          "LONG",
    "float64":        "DOUBLE",
    "bool":           "BOOL",
    'datetime64': "TIMESTAMP",
    "object":         "STRING",
    "category":       "STRING",
}

# Generate the columns part of the payload dynamically
columns = []
for col, dtype in dataset.dtypes.items():
    griddb_type = type_mapping.get(str(dtype), "STRING")  # Default to STRING if unknown
    columns.append({
        "name": col,
        "type": griddb_type
    })

columns
Output:
[{'name': 'SerialNo', 'type': 'LONG'},
 {'name': 'Date', 'type': 'STRING'},
 {'name': 'Close', 'type': 'DOUBLE'},
 {'name': 'High', 'type': 'DOUBLE'},
 {'name': 'Low', 'type': 'DOUBLE'},
 {'name': 'Open', 'type': 'DOUBLE'},
 {'name': 'Volume', 'type': 'LONG'}]
The above output displays the dataset column names and their corresponding GridDB-compliant data types.
The next step is to create a GridDB container. To do so, you need to pass the container name, container type, and a list of column names and their data types.
url = f"{base_url}/containers"
container_name = "stock_db"
# Create the payload for the POST request
payload = json.dumps({
    "container_name": container_name,
    "container_type": "COLLECTION",
    "rowkey": True,  # Assuming the first column as rowkey
    "columns": columns
})


# Make the POST request to create the container
response = requests.post(url, headers=headers, data=payload)

# Print the response
print(f"Status Code: {response.status_code}")
Adding Stock Data to GridbDB Cloud Container
Once you have created a container, you must convert the data from your Pandas dataframe into the JSON format and call a put request to insert data into GridDB.
url = f"{base_url}/containers/{container_name}/rows"
# Convert dataset to list of lists (row-wise) with proper formatting

def format_row(row):
    formatted = []
    for item in row:
        if pd.isna(item):
            formatted.append(None)  # Convert NaN to None
        elif isinstance(item, bool):
            formatted.append(str(item).lower())  # Convert True/False to true/false
        elif isinstance(item, (int, float)):
            formatted.append(item)  # Keep integers and floats as they are
        else:
            formatted.append(str(item))  # Convert other types to string
    return formatted

# Prepare rows with correct formatting
rows = [format_row(row) for row in dataset.values.tolist()]

# Create payload as a JSON string
payload = json.dumps(rows)

# Make the PUT request to add the rows to the container
response = requests.put(url, headers=headers, data=payload)

# Print the response
print(f"Status Code: {response.status_code}")
print(f"Response Text: {response.text}")
Output:
Status Code: 200
Response Text: {"count":251}
If you see the above response, you have successfully inserted the data.
Retrieving Data from GridDB
After inserting the data, you can perform a variety of operations on the dataset.
Let’s see how to import data from a GridDB container into a Pandas dataframe.
container_name = "stock_db"

url = f"{base_url}/containers/{container_name}/rows"

# Define the payload for the query
payload = json.dumps({
    "offset": 0,           # Start from the first row
    "limit": 10000,         # Limit the number of rows returned
    "condition": "",       # No filtering condition (you can customize it)
    "sort": ""             # No sorting (you can customize it)
})

# Make the POST request to read data from the container
response = requests.post(url, headers=headers, data=payload)

# Check response status and print output
print(f"Status Code: {response.status_code}")
if response.status_code == 200:
    try:
        data = response.json()
        print("Data retrieved successfully!")

        # Convert the response to a DataFrame
        rows = data.get("rows", [])
        stock_dataset = pd.DataFrame(rows, columns=[col for col in dataset.columns])

    except json.JSONDecodeError:
        print("Error: Failed to decode JSON response.")
else:
    print(f"Error: Failed to query data from the container. Response: {response.text}")

print(stock_dataset.shape)
stock_dataset.head()
Output:
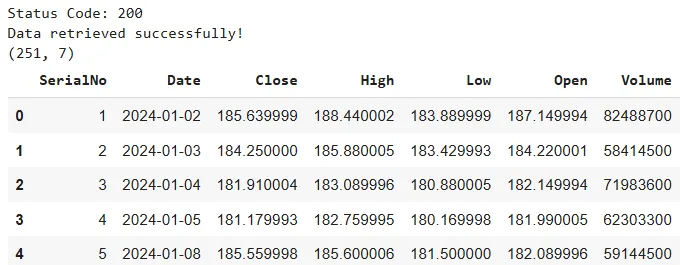
The above output shows the data retrieved from the GridDB container. We store the data in a Pandas dataframe. You can store the data in any other format if you want.
Once you have the data, you can create a variety of AI and data science applications.
Creating a Stock Market Chatbot Using GridDB Data
In this next section, you will see how to create a simple chatbot in LangGraph framework, which calls the OpenAI API to answer your questions about the Apple stock price you just retrieved from the GridDB.
Creating a Graph in LangGraph
To create a Graph in LangGraph, you need to define its state. A graph’s state contains attributes that are shared between multiple graph nodes. Since we only need to store questions and answers, we create the following graph state.
class State(TypedDict):
    question: str
    answer: str
We will use the create_pandas_dataframe_agent from LangChain to answer our questions since we retrieved data from Gridb into a Pandas dataframe.
We will create the agent object and will call it inside the run_llm() function we define. We will use this function in our LangGraph node.
api_key = "YOUR_OPENAI_API_KEY"
llm = ChatOpenAI(model = 'gpt-4o',
                api_key = api_key)

agent = create_pandas_dataframe_agent(llm,
                                      stock_dataset,
                                      verbose=True,
                                      agent_type=AgentType.ZERO_SHOT_REACT_DESCRIPTION,
                                      allow_dangerous_code=True)

def run_llm(state: State):
    question = state['question']
    response = agent.invoke(question)
    return {'answer': response['output']}
Finally, we define the graph for our chatbot. The graph consists of only one node, ask_question, which calls the run_llm() function. Inside the function, we call the create_pandas_dataframe_agent(), which answers questions about the dataset.
graph_builder=StateGraph(State)
graph_builder.add_node("ask_question", run_llm)
graph_builder.add_edge(START,"ask_question")
graph_builder.add_edge("ask_question",END)
graph = graph_builder.compile()

display(Image(graph.get_graph().draw_mermaid_png()))
Output:
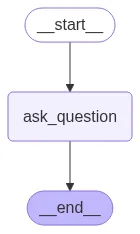
The above output shows the flow of our graph.
Asking Questions
Let’s test our chatbot by asking some questions. We will first ask our chatbot about the month that had the highest average opening price—also, the month where people made the most profit in day trading.
question = [HumanMessage(content="Which month had the highest average opening stock price? And what is the month where people made most profit in day trading?")]
result = graph.invoke({"question": question})
print(result['answer'])
Output:
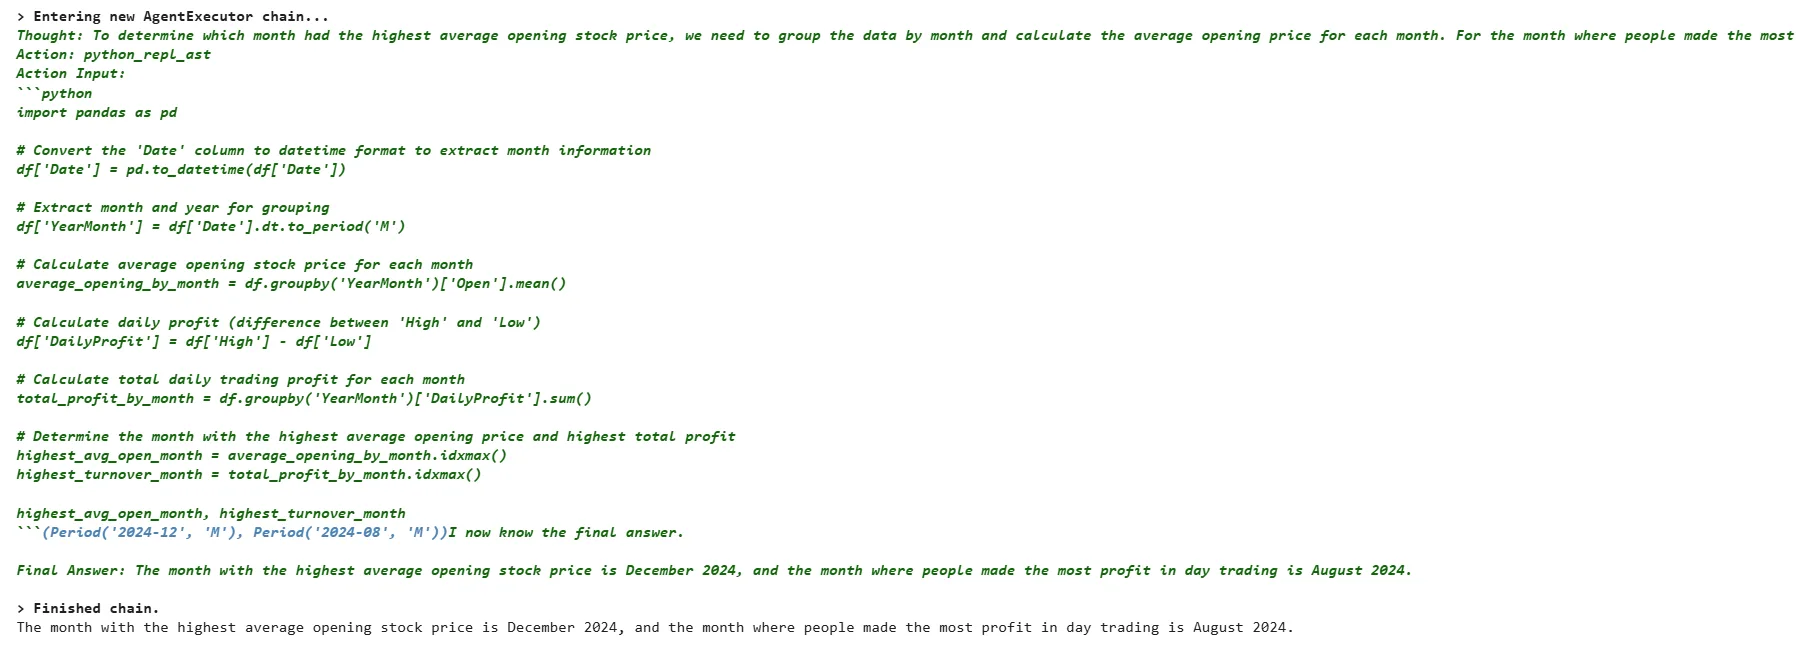
The output above shows the chatbot’s response. That is correct; I verified it manually using a Python script.
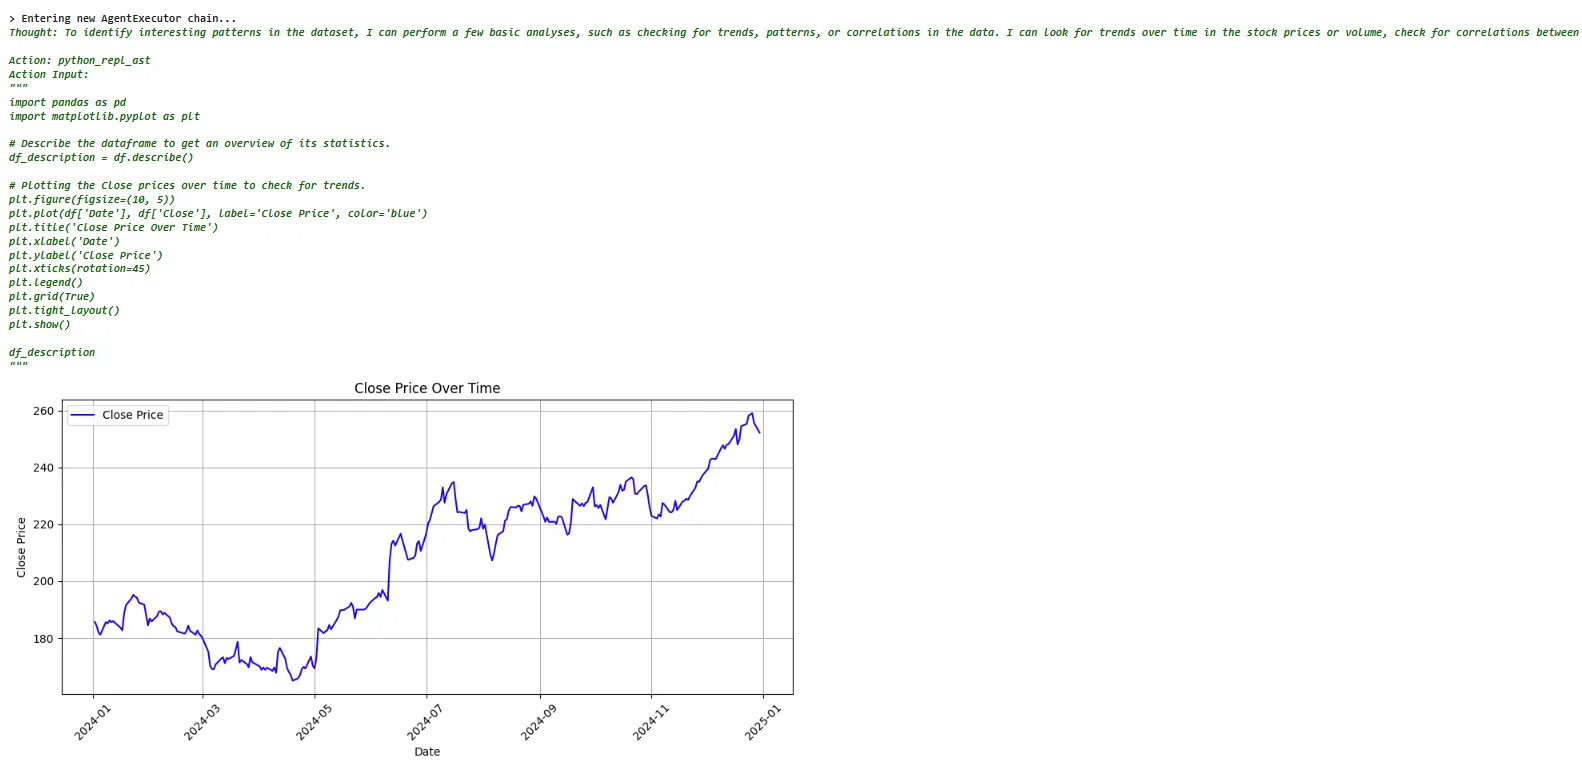
Let’s ask it to be more creative and see if it finds any interesting patterns in the dataset.
question = [HumanMessage(content="Do you find any interesting patterns in the dataset?")]
result = graph.invoke({"question": question})
print(result['answer'])
Output:
 g src=”imagesimg5-chatbot-response2b.png”>
The above output shows the first part of the reply. You can see that the chatbot is intelligent enough to draw a plot for the closing prices to identify interesting patterns.
The following output shows some interesting observations from the dataset.
Output:
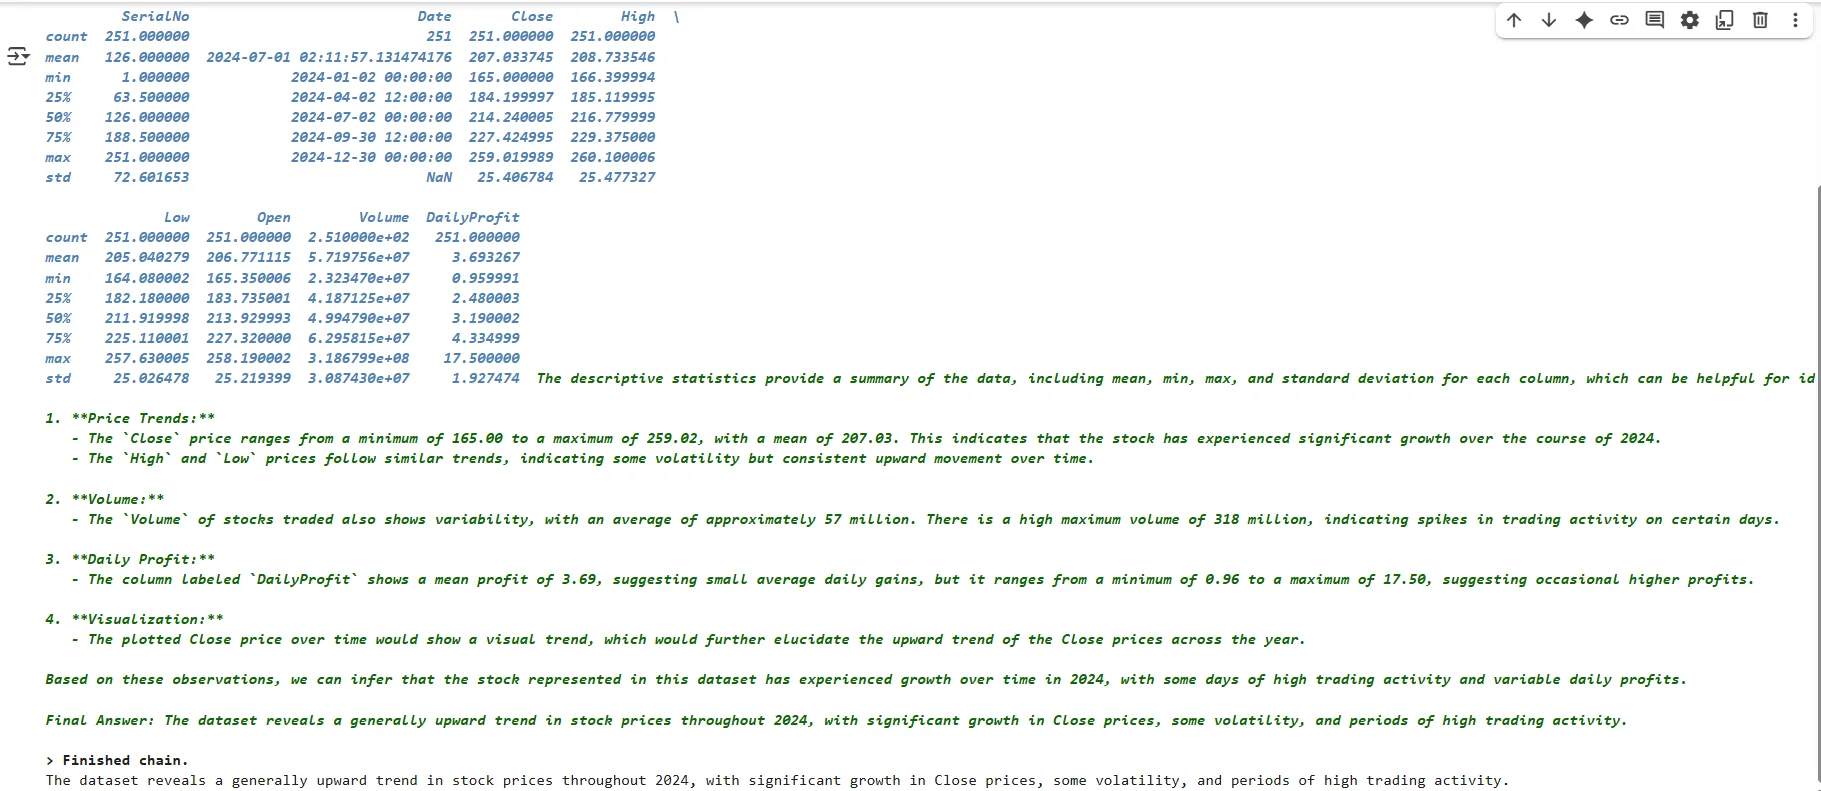 g src=”imagesimg5-chatbot-response2b.png”>
Conclusion
The article demonstrates how to create an OpenAI API-based chatbot that answers questions related to data retrieved from GridDB.
If you have any questions or need help with GridDB cloud, you can leave your query on Stack Overflow using the griddb tag. Our team will be happy to answer it.
For the complete code of this article, visit my GridDB Blogs GitHub repository.
If you have any questions about the blog, please create a Stack Overflow post here https://stackoverflow.com/questions/ask?tags=griddb .
Make sure that you use the “griddb” tag so our engineers can quickly reply to your questions.