Introduction
Smart cities are transforming urban landscapes by leveraging technology to improve efficiency and sustainability. A key component of smart cities is environmental monitoring, which involves the collection, aggregation, and analysis of real-time data to address challenges like air pollution, traffic congestion, and resource management. By leveraging innovative database technologies, smart cities can unlock actionable insights that drive sustainability and improve urban living standards.
This article delves into how GridDB, a high-performance database tailored for time-series and IoT data, supports environmental monitoring in smart cities. Using real-time data streams like pollen levels, illness risk metrics, and air quality indices, we showcase how GridDB effectively manages large data volumes with speed and precision, empowering informed decision-making for a smarter, more sustainable urban future.
Understanding the Use Case
To demonstrate a practical application, we integrate environmental data from Ambee, a trusted provider of real-time environmental information. Using GridDB’s robust capabilities, we aggregate and analyze this data, uncovering patterns and insights that can guide policymakers and stakeholders in enhancing urban sustainability.
In this article, we focus on three specific datasets crucial for smart city management:
-
Pollen Data: This dataset tracks allergen levels to predict periods of heightened allergy risks, enabling authorities to issue timely health advisories.
-
Illness Risk Data: By analyzing environmental conditions, this dataset assesses the probability of disease outbreaks, aiding public health planning.
-
Air Quality Data: Monitoring pollutants such as PM2.5, PM10, and NO2 ensures compliance with health standards and helps mitigate pollution’s impact on urban life.
Together, these datasets, sourced from Ambee, serve as the basis for our study, highlighting the potential of GridDB for real-time environmental monitoring and data-driven decision-making.
Setting Up GridDB Cluster and Spring Boot Integration: For Environmental Monitoring
The first step is to set up a GridDB cluster and integrate it with our Spring Boot application as follows.
-
Setting up GridDB Cluster
GridDB provides flexible options to meet different requirements. For development, a single-node cluster on our local machine may be sufficient. However, in production, distributed clusters across multiple machines are typically preferred for improved fault tolerance and scalability. For detailed guidance on setting up clusters based on our deployment strategy, refer to the GridDB documentation.
To set up a GridDB cluster, follow the steps mentioned here.
-
Setting up Spring Boot Application
Once our GridDB cluster is operational, the next step is connecting it to ourSpring Boot application. The GridDB Java Client API provides the necessary tools to establish this connection. To simplify the process, you can include the
griddb-spring-boot-starterlibrary as a dependency in our project, which offers pre-configured beans for a streamlined connection setup. -
Setting Up API Access
To begin, visit www.getambee.com and create an account. After registering, you’ll be provided with an API key, which is required for authentication when making requests to their endpoints. This key grants access to various environmental data services offered by the platform.
Pricing Plans
Ambee offers flexible pricing plans to suit different needs:
- Free Tier: Ideal for developers or small-scale projects, with limited API calls per month.
- Paid Plans: Designed for larger-scale applications, these plans provide higher API limits and additional features.
Project Structure
Here’s a suggested project structure for this application:
└───my-griddb-app
    │   pom.xml
    │
    ├───src
    │   ├───main
    │   │   ├───java
    │   │   │   └───mycode
    │   │   │       │   MySpringBootApplication.java
    │   │   │       │
    │   │   │       ├───config
    │   │   │       │       GridDBConfig.java
    │   │   │       │
    │   │   │       ├───controller
    │   │   │       │       ChartController.java
    │   │   │       │
    │   │   │       ├───dto
    │   │   │       │       AirQualityDTO.java
    │   │   │       │       IllnessRiskDTO.java
    │   │   │       │       PollenDataDTO.java
    │   │   │       │
    │   │   │       └───service
    │   │   │               ChartService.java
    │   │   │               MetricsCollectionService.java
    │   │   │               RestTemplateConfig.java
    │   │   │
    │   │   └───resources
    │   │       │   application.properties
    │   │       │
    │   │       └───templates
    │   │               charts.html
    │   │
    │   └───test
    │       └───java
    │           └───com
    │               └───example
    │                       AppTest.java
This structure separates controllers, models, repositories, services, and the application entry point into distinct layers, enhancing modularity and maintainability.
Add GridDB Dependency
To enable interaction with GridDB in our Spring Boot project, we must include the GridDB Java Client API dependency. This can be accomplished by adding the appropriate configuration to the project build file, such as pom.xml for Maven or the equivalent file for Gradle.
Here’s an example of how to configure the dependency in thepom.xml file:
<project
  xmlns_xsi="http://www.w3.org/2001/XMLSchema-instance"
  xsi_schemaLocation="http://maven.apache.org/POM/4.0.0 http://maven.apache.org/maven-v4_0_0.xsd">
  <modelVersion>4.0.0</modelVersion>
  <groupId>com.example</groupId>
  <artifactId>my-griddb-app</artifactId>
  <version>1.0-SNAPSHOT</version>
  <name>my-griddb-app</name>
  <url>http://maven.apache.org</url>

  <parent>
    <groupId>org.springframework.boot</groupId>
    <artifactId>spring-boot-starter-parent</artifactId>
    <version>3.2.4</version>
    <relativePath /> <!-- lookup parent from repository -->
  </parent>

  <properties>
    <maven.compiler.source>17</maven.compiler.source>
    <maven.compiler.target>17</maven.compiler.target>
  </properties>

  <dependencies>
    <dependency>
      <groupId>org.springframework.boot</groupId>
      <artifactId>spring-boot-starter-actuator</artifactId>
    </dependency>
    <dependency>
      <groupId>junit</groupId>
      <artifactId>junit</artifactId>
      <version>3.8.1</version>
      <scope>test</scope>
    </dependency>
    <!-- GridDB dependencies -->
    <dependency>
      <groupId>com.github.griddb</groupId>
      <artifactId>gridstore</artifactId>
      <version>5.6.0</version>
    </dependency>
    <!-- Spring Boot dependencies -->
    <dependency>
      <groupId>org.springframework.boot</groupId>
      <artifactId>spring-boot-starter-web</artifactId>
      <exclusions>
        <exclusion>
          <groupId>org.springframework.boot</groupId>
          <artifactId>spring-boot-starter-logging</artifactId>
        </exclusion>
      </exclusions>
    </dependency>
    <dependency>
      <groupId>org.springframework.boot</groupId>
      <artifactId>spring-boot-starter-test</artifactId>
      <scope>test</scope>
    </dependency>
    <dependency>
      <groupId>org.springframework.boot</groupId>
      <artifactId>spring-boot-starter-thymeleaf</artifactId>
    </dependency>
    <!-- JSON processing -->
    <dependency>
      <groupId>com.fasterxml.jackson.core</groupId>
      <artifactId>jackson-databind</artifactId>
      <version>2.15.0</version> <!-- or the latest version -->
    </dependency>
    <!-- Lombok -->
    <dependency>
      <groupId>org.projectlombok</groupId>
      <artifactId>lombok</artifactId>
      <optional>true</optional>
    </dependency>
  </dependencies>
</project>
Configure GridDB Connection
After adding the GridDB dependency, the next step is configuring the connection details for our GridDB cluster in our Spring Boot application. This is usually configured in the application.properties file, where you can specify various settings for the application.
Here’s a quick example of how to set up those connection details:
GRIDDB_NOTIFICATION_MEMBER=127.0.0.1:10001
GRIDDB_CLUSTER_NAME=myCluster
GRIDDB_USER=admin
GRIDDB_PASSWORD=admin
management.endpoints.web.exposure.include=*
server.port=9090
#API token
api.token=<enter your API Key></enter>-
griddb.cluster.port: The port number on which the GridDB cluster is listening. -
griddb.cluster.user: The username for accessing the GridDB cluster. -
griddb.cluster.password: The password for the specified GridDB user (replace with ouractual password). -
server.port=9090: Sets the port on which ourSpring Boot application will run. -
api.token: API token for authentication purposes.
Create GridDB Client Bean
To interact effectively with GridDB in our Spring Boot application,we need to create a dedicated Spring Bean to manage the GridDB connection. This bean will establish the connection using the parameters defined in the application.properties file and will act as the central interface for interacting with the GridDB cluster across the application.
Here’s an example of how to define this bean in a Java class named GridDbConfig.java:
package mycode.config;

import java.util.Properties;

import org.springframework.beans.factory.annotation.Value;
import org.springframework.context.annotation.Bean;
import org.springframework.context.annotation.Configuration;
import org.springframework.context.annotation.PropertySource;

import com.toshiba.mwcloud.gs.GSException;
import com.toshiba.mwcloud.gs.GridStore;
import com.toshiba.mwcloud.gs.GridStoreFactory;

@Configuration
@PropertySource("classpath:application.properties")
public class GridDBConfig {

 @Value("${GRIDDB_NOTIFICATION_MEMBER}")
  private String notificationMember;

 @Value("${GRIDDB_CLUSTER_NAME}")
  private String clusterName;

 @Value("${GRIDDB_USER}")
  private String user;

 @Value("${GRIDDB_PASSWORD}")
  private String password;

 @Bean
  public GridStore gridStore() throws GSException {
    // Acquiring a GridStore instance
    Properties properties = new Properties();
    properties.setProperty("notificationMember", notificationMember);
    properties.setProperty("clusterName", clusterName);
    properties.setProperty("user", user);
    properties.setProperty("password", password);
    return GridStoreFactory.getInstance().getGridStore(properties);
 }
}
Metric Collection
Our primary focus is on the MetricCollection.java class, where API calls to external services are made, and the collected data is processed and stored. This class serves as a bridge between the external APIs and the backend system, ensuring seamless integration with GridDB for real-time analytics and decision-making.
Ambee provides a rich set of endpoints to fetch real-time environmental data. For this project, we’ll focus on the following key endpoints:
-
Pollen Data API:
This endpoint provides allergen levels for specific locations, helping to monitor pollen concentrations and predict allergy outbreaks. It is essential for public health, as it allows authorities to issue timely advisories for people with respiratory conditions or allergies. -
Air Quality API:
This API provides data on various pollutants such as PM2.5, PM10, CO, and NO2. Monitoring air quality is crucial for ensuring compliance with health standards and mitigating pollution’s impact on public health. It helps cities take proactive steps in reducing pollution and protecting residents’ well-being. -
Illness Risk API:
This endpoint returns calculated risk scores based on environmental conditions such as pollution levels, temperature, and humidity. It plays a critical role in public health, enabling early detection of potential health risks and informing decisions on preventive measures to reduce illness outbreaks in urban areas.
All above APIs use RESTful architecture and return responses in JSON format.
Key Components of the MetricCollection.java Class
-
API Key Management: The API key is injected into the service via the
@Valueannotation. This allows the project to securely access the external Ambee API services without hardcoding sensitive credentials directly into the codebase. -
RestTemplate for API Calls: The
RestTemplateobject is used for making HTTP requests. It simplifies the process of invoking REST APIs and handling the response data. We are usingrestTemplate.getForObject()to fetch JSON data from the APIs and return it as a string. This data can then be processed or converted into a more structured format, like objects or entities, for further analysis. -
Data Storage in GridDB:
The environmental data fetched from the APIs is stored in GridDB’s time-series containers for efficient management and querying. Here’s how the data is persisted:-
Pollen Data:
A time-series container named"PollenData"is created using thePollenDataDTOclass. Each data entry is appended to this container. -
Illness Risk Data:
A similar container,"IllnessRiskData", is created for storing data related to contamination risks using theIllnessRiskDTOclass. -
Air Quality Data:
Another time-series container,"AirQualityData", is set up for storing air quality metrics using theAirQualityDTOclass.
-
Fetching and Processing the Data
Each method in the MetricCollection.java class is designed to collect specific environmental data:
-
Air Quality: The
getAirQualityDatamethod is responsible for fetching real-time air quality data for a given city. It contacts the Ambee air quality API and retrieves the data in JSON format. -
Pollen Data: Similarly, the
getPollenDatamethod makes a request to the Ambee pollen API to gather pollen data, which is vital for assessing allergens in the air, particularly for individuals with respiratory conditions. -
Illness Risk: The
getIllnessRiskDatamethod provides critical insights into potential health risks caused by environmental factors such as pollution levels or seasonal changes, allowing for proactive health management.
Data Transformation
After retrieving the raw JSON data, it can be parsed and converted into Java objects for streamlined processing. By mapping the JSON response to custom Java classes, such as AirQualityDTO, IllnessRiskDTO, and PollenDataDTO, the data becomes easier to manage and transform within the system for further analysis and visualization.
Below is the implementation of these DTO classes.
@Data
@NoArgsConstructor
@AllArgsConstructor
public class AirQualityDTO {
  @RowKey
  public Date updatedAt;
  private double lat;
  private double lng;
  private String city;
  private String state;
  private double pm10;
  private double pm25;
  private double no2;
  private double so2;
  private double co;
  private double ozone;
  private int aqi;
  private String pollutant;
  private double concentration;
  private String category;
}
@Data
@NoArgsConstructor
@AllArgsConstructor
public class IllnessRiskDTO {
@RowKey
public Date createdAt;
private double lat;
private double lng;
private String iliRisk;
}@Data
@NoArgsConstructor
@AllArgsConstructor
public class PollenDataDTO {
@RowKey
public Date updatedAt;
private double lat;
private double lng;
private String grassPollenRisk;
private String treePollenRisk;
private String weedPollenRisk;
private int grassPollenCount;
private int treePollenCount;
private int weedPollenCount;
}Storing Data in GridDB
After transforming the data into Java objects, it is stored in GridDB for real-time querying and analysis.
Here’s a brief snippet of how the data insertion look:
Scheduling Data Collection
To ensure the data is regularly collected, you can use Spring Boot’s @Scheduled annotation to trigger API calls at fixed intervals. This makes sure the data is updated regularly to support real-time monitoring and analytics.
  @Scheduled(fixedRate = 4000)
  public void collectMetrics() throws GSException, JsonMappingException, JsonProcessingException, ParseException {

    List<pollendatadto> pollenData = fetchPollenData();
    List<illnessriskdto> illnessRiskData = fetchIllnessRiskData();
    List<airqualitydto> airQualityData = fetchAirQualityData();

    // Store Pollen Data
    TimeSeries<pollendatadto> pollenSeries = store.putTimeSeries("PollenData", PollenDataDTO.class);
    for (PollenDataDTO data : pollenData) {
      pollenSeries.append(data);
    }

    // Store Illness Risk Data
    TimeSeries<illnessriskdto> illnessRiskSeries = store.putTimeSeries("IllnessRiskData", IllnessRiskDTO.class);
    for (IllnessRiskDTO data : illnessRiskData) {
      illnessRiskSeries.append(data);
    }

    // Store Air Quality Data
    TimeSeries<airqualitydto> airQualitySeries = store.putTimeSeries("AirQualityData", AirQualityDTO.class);
    for (AirQualityDTO data : airQualityData) {
      airQualitySeries.append(data);
    }
  }</airqualitydto></illnessriskdto></pollendatadto></airqualitydto></illnessriskdto></pollendatadto>
By following above steps, we can effectively extract data from Ambee, load it into GridDB database.
Data Querying in GridDB and Visualization with Thymeleaf
Once the data is stored and available in GridDB, the next step is to visualize this data in a way that provides actionable insights.
In this section, we’ll explore how to build a dashboard using Spring Boot, Thymeleaf, and Chart.js to render charts that displays realtime environment data.
Here are the steps to achieve this:
- Building the Chart Controller
The ChartController acts as the intermediary between backend data in GridDB and the frontend visualizations displayed on the dashboard. Its responsibilities include handling HTTP requests, interacting with the service layer to fetch data, and passing that data to Thymeleaf templates for rendering.
Here’s how the ChartController is implemented:
package mycode.controller;

import org.springframework.beans.factory.annotation.Autowired;
import org.springframework.stereotype.Controller;
import org.springframework.ui.Model;
import org.springframework.web.bind.annotation.GetMapping;

import mycode.service.ChartService;
import mycode.dto.AirQualityDTO;
import mycode.dto.IllnessRiskDTO;
import mycode.dto.PollenDataDTO;

import java.util.List;

@Controller
public class ChartController {

  @Autowired
  private ChartService chartService;

  @GetMapping("/charts")
  public String showCharts(Model model) {
    try {
      // Fetch data for charts
      List<pollendatadto> pollenData = chartService.getPollenData();
      List<illnessriskdto> illnessRiskData = chartService.getIllnessRiskData();
      List<airqualitydto> airQualityData = chartService.getAirQualityData();

      // Add data to the model for Thymeleaf
      model.addAttribute("pollenData", pollenData);
      model.addAttribute("illnessRiskData", illnessRiskData);
      model.addAttribute("airQualityData", airQualityData);
    } catch (Exception e) {
      model.addAttribute("error", "Unable to fetch data: " + e.getMessage());
    }

    return "charts";
  }
}</airqualitydto></illnessriskdto></pollendatadto>- Implementing the Chart Service
The ChartService acts as the business logic layer, encapsulating the operations needed to query GridDB and process the results.
In this context, the ChartService class accesses a GridStore database container to retrieve environmental monitoring data. The service then compiles these objects into a list representing the environmental metrics, ready for use in analysis or visualization.
Here’s how the ChartService is implemented:
package mycode.service;

import java.text.SimpleDateFormat;
import java.util.ArrayList;
import java.util.Date;
import java.util.List;
import org.springframework.beans.factory.annotation.Autowired;
import org.springframework.stereotype.Service;

import com.toshiba.mwcloud.gs.Container;
import com.toshiba.mwcloud.gs.GridStore;
import com.toshiba.mwcloud.gs.Query;
import com.toshiba.mwcloud.gs.Row;
import com.toshiba.mwcloud.gs.RowSet;
import com.toshiba.mwcloud.gs.TimeSeries;

import mycode.dto.AirQualityDTO;
import mycode.dto.IllnessRiskDTO;
import mycode.dto.PollenDataDTO;

@Service
public class ChartService {

  @Autowired
  GridStore store;

  public List<pollendatadto> getPollenData() throws Exception {
    Container container = store.getContainer("PollenData");
    if (container == null) {
      throw new Exception("PollenData container not found.");
    }

    List</pollendatadto><pollendatadto> pollenDataList = new ArrayList<>();
    SimpleDateFormat dateFormat = new SimpleDateFormat("yyyy-MM-dd'T'HH:mm:ss.SSS'Z'");
    Date now = new Date();
    String nowString = dateFormat.format(now);
    String startTime = "1971-12-23T18:18:52.000Z";

    String queryString = "select * where updatedAt >= TIMESTAMP('" + startTime
        + "') and UpdatedAt <= TIMESTAMP('" + nowString + "')";
    Query<row> query = container.query(queryString);
    RowSet</row><row> rs = query.fetch();

    while (rs.hasNext()) {
      Row row = rs.next();
      PollenDataDTO pollenData = new PollenDataDTO();
      pollenData.setUpdatedAt(row.getTimestamp(0));
      pollenData.setTreePollenCount(row.getInteger(4));
      pollenData.setGrassPollenCount(row.getInteger(8));
      pollenData.setWeedPollenCount(row.getInteger(5));
      pollenDataList.add(pollenData);
    }
    return pollenDataList;
  }

  public List<illnessriskdto> getIllnessRiskData() throws Exception {
    Container

 container = store.getContainer("IllnessRiskData");
    if (container == null) {
      throw new Exception("IllnessRiskData container not found.");
    }

    List</illnessriskdto><illnessriskdto> illnessRiskList = new ArrayList<>();
    SimpleDateFormat dateFormat = new SimpleDateFormat("yyyy-MM-dd'T'HH:mm:ss.SSS'Z'");
    Date now = new Date();
    String nowString = dateFormat.format(now);
    String startTime = "1971-12-23T18:18:52.000Z";

    String queryString = "select * where createdAt >= TIMESTAMP('" + startTime
        + "') and createdAt <= TIMESTAMP('" + nowString + "')";
    Query<row> query = container.query(queryString);
    RowSet</row><row> rs = query.fetch();

    while (rs.hasNext()) {
      Row row = rs.next();
      IllnessRiskDTO illnessRisk = new IllnessRiskDTO();
      illnessRisk.setCreatedAt(row.getTimestamp(0));
      illnessRisk.setLat(row.getDouble(1));
      illnessRisk.setLng(row.getDouble(2));
      illnessRisk.setIliRisk(row.getString(3));
      illnessRiskList.add(illnessRisk);
    }
    return illnessRiskList;
  }

  public List<airqualitydto> getAirQualityData() throws Exception {
    Container

 container = store.getContainer("AirQualityData");
    if (container == null) {
      throw new Exception("AirQualityData container not found.");
    }

    List</airqualitydto><airqualitydto> airQualityList = new ArrayList<>();
    SimpleDateFormat dateFormat = new SimpleDateFormat("yyyy-MM-dd'T'HH:mm:ss.SSS'Z'");
    Date now = new Date();
    String nowString = dateFormat.format(now);
    String startTime = "1971-12-23T18:18:52.000Z";

    String queryString = "select * where updatedAt >= TIMESTAMP('" + startTime
        + "') and updatedAt <= TIMESTAMP('" + nowString + "')";
    Query<row> query = container.query(queryString);
    RowSet</row><row> rs = query.fetch();

    while (rs.hasNext()) {
      Row row = rs.next();
      AirQualityDTO airQuality = new AirQualityDTO();
      airQuality.setUpdatedAt(row.getTimestamp(0));
      airQuality.setLat(row.getDouble(2));
      airQuality.setLng(row.getDouble(3));
      airQuality.setPm25(row.getDouble(7));
      airQuality.setPm10(row.getDouble(12));
      airQuality.setOzone(row.getDouble(14));
      airQuality.setAqi(row.getInteger(9));
      airQuality.setCategory(row.getString(5));
      airQualityList.add(airQuality);
    }
    return airQualityList;
  }
}</row></airqualitydto></row></illnessriskdto></row></pollendatadto>- Rendering Charts with Thymeleaf
Once we’ve retrieved the data from GridDB, we can pass it to a Thymeleaf template for visualization. Thymeleaf provides an efficient way to generate dynamic HTML pages, making it ideal for rendering the query results as charts, tables, or other visual components.
Below is the implementation of charts.html:
<!DOCTYPE html>
<html xmlns_th="http://www.thymeleaf.org">
<head>
<title>Environmental Monitoring Data</title>
<script src="https://cdn.jsdelivr.net/npm/chart.js"></script>
<style>
body {
font-family: Arial, sans-serif;
margin: 20px;
}
h1 {
text-align: center;
color: #333;
}
h2 {
margin-top: 40px;
color: #555;
}
.chart-container {
position: relative;
margin: auto;
max-width: 800px;
padding: 20px;
}
canvas {
background: #f9f9f9;
border-radius: 8px;
box-shadow: 0 4px 6px rgba(0, 0, 0, 0.1);
}
.no-data {
text-align: center;
color: #999;
margin-top: 20px;
}
</style>
</head>
<body>
<h1>Environmental Monitoring Data</h1>
<!-- Pollen Data Chart -->
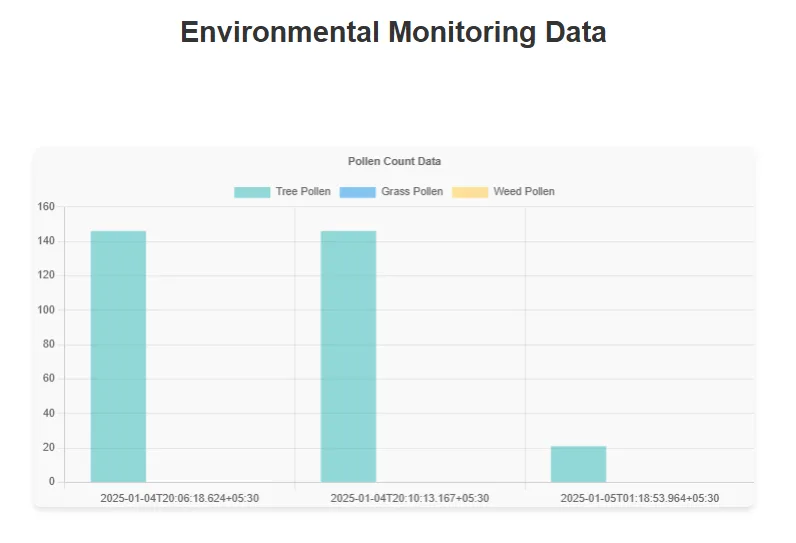
<h2>Pollen Data</h2>
<div class="chart-container">
<canvas id="pollenChart"></canvas>
<div id="pollenNoData" class="no-data" style="display: none;">No pollen data available</div>
</div>
<script th_inline="javascript">
const pollenData = /*[[${pollenData}]]*/[];
if (pollenData.length > 0) {
const pollenLabels = pollenData.map(d => d.updatedAt);
const treePollen = pollenData.map(d => d.treePollenCount);
const grassPollen = pollenData.map(d => d.grassPollenCount);
const weedPollen = pollenData.map(d => d.weedPollenCount);
new Chart(document.getElementById('pollenChart'), {
type: 'bar',
data: {
labels: pollenLabels,
datasets: [
{ label: 'Tree Pollen', data: treePollen, backgroundColor: 'rgba(75, 192, 192, 0.6)' },
{ label: 'Grass Pollen', data: grassPollen, backgroundColor: 'rgba(54, 162, 235, 0.6)' },
{ label: 'Weed Pollen', data: weedPollen, backgroundColor: 'rgba(255, 206, 86, 0.6)' }
]
},
options: {
responsive: true,
plugins: {
legend: { position: 'top' },
title: { display: true, text: 'Pollen Count Data' }
}
}
});
} else {
document.getElementById('pollenNoData').style.display = 'block';
}
</script>
<!-- Illness Risk Chart -->
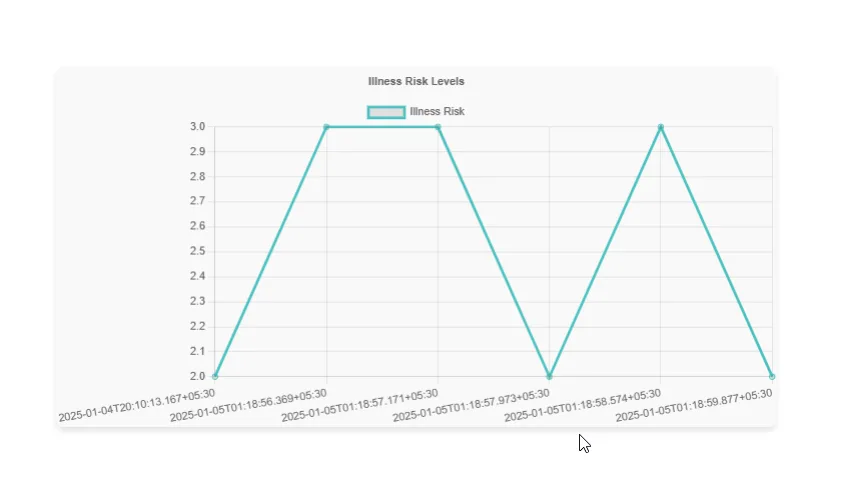
<h2>Illness Risk Data</h2>
<div class="chart-container">
<canvas id="illnessRiskChart"></canvas>
<div id="illnessNoData" class="no-data" style="display: none;">No illness risk data available</div>
</div>
<script th_inline="javascript">
const illnessData = /*[[${illnessRiskData}]]*/[];
if (illnessData.length > 0) {
const riskLevelToNumeric = { "Low": 1, "Moderate": 2, "High": 3 };
const illnessLabels = illnessData.map(d => d.createdAt);
const illnessValues = illnessData.map(d => riskLevelToNumeric[d.iliRisk] || 0);
new Chart(document.getElementById('illnessRiskChart'), {
type: 'line',
data: {
labels: illnessLabels,
datasets: [{ label: 'Illness Risk', data: illnessValues, borderColor: 'rgba(75, 192, 192, 1)', fill: false }]
},
options: {
responsive: true,
plugins: {
legend: { position: 'top' },
title: { display: true, text: 'Illness Risk Levels' }
}
}
});
} else {
document.getElementById('illnessNoData').style.display = 'block';
}
</script>
<!-- Air Quality Chart -->
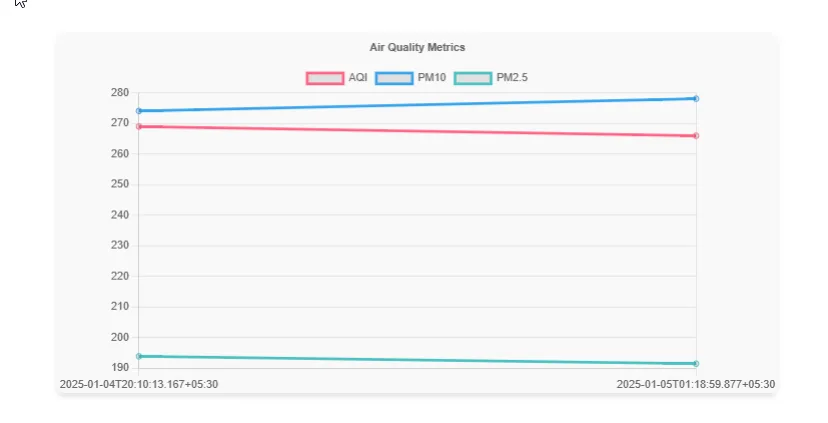
<h2>Air Quality Data</h2>
<div class="chart-container">
<canvas id="airQualityChart"></canvas>
<div id="airQualityNoData" class="no-data" style="display: none;">No air quality data available</div>
</div>
<script th_inline="javascript">
const airQualityData = /*[[${airQualityData}]]*/[];
if (airQualityData.length > 0) {
const airQualityLabels = airQualityData.map(d => d.updatedAt);
const aqiValues = airQualityData.map(d => d.aqi);
const pm10Values = airQualityData.map(d => d.pm10);
const pm25Values = airQualityData.map(d => d.pm25);
new Chart(document.getElementById('airQualityChart'), {
type: 'line',
data: {
labels: airQualityLabels,
datasets: [
{ label: 'AQI', data: aqiValues, borderColor: 'rgba(255, 99, 132, 1)', fill: false },
{ label: 'PM10', data: pm10Values, borderColor: 'rgba(54, 162, 235, 1)', fill: false },
{ label: 'PM2.5', data: pm25Values, borderColor: 'rgba(75, 192, 192, 1)', fill: false }
]
},
options: {
responsive: true,
plugins: {
legend: { position: 'top' },
title: { display: true, text: 'Air Quality Metrics' }
}
}
});
} else {
document.getElementById('airQualityNoData').style.display = 'block';
}
</script>
</body>
</html>Running the Project
To run the project, execute the following command to build and run our application:
mvn clean install && mvn spring-boot:run Accessing the Dashboard
After starting the application, open a web browser and go to http://localhost:9090.
This URL provides access to our Thymeleaf-powered dashboard, showcasing visualizations of environmental metrics, including air quality, pollen levels, and contamination risks, presented through interactive charts.
The charts on this dashboard is dynamically rendered using real time data retrieved from Ambee and processed by the application’s ChartService.
Data Access in GridDB:
The GridDB Shell tool also allows for access and querying of data via the command line, as illustrated below.
gs[public]> select * from AirQualityData;
gs[public]> select * from IllnessRiskData;
gs[public]> select * from PollenData;
gs[public]> get 1
Conclusion:
Real-time environmental data is essential for smart cities to optimize urban management and enhance public health. By aggregating and analyzing data such as air quality, traffic flow, and illness risk, authorities can make precise, data-driven decisions for resource allocation and risk mitigation.
GridDB’s high-performance, distributed architecture is tailored for handling large-scale, time-series data with minimal latency. Its ability to process vast amounts of data in real time allows for efficient querying and aggregation, making it the ideal solution for smart city applications that require fast, scalable data analysis to support informed, actionable insights.
If you have any questions about the blog, please create a Stack Overflow post here https://stackoverflow.com/questions/ask?tags=griddb .
Make sure that you use the “griddb” tag so our engineers can quickly reply to your questions.