Many dashboard apps need to visualize time-series data to users. This data could be price information, web analytics, or anything else you could imagine.
In this tutorial, we’ll create a server memory monitor for a Node.js server. This will take a reading of system memory every second and store it in a database.
This data will then be displayed with a dashboard visualization in a frontend Vue app.
We’ll also be using GridDB which makes it easy to write and retrieve time-series data. We’ll expose the data as a public API using the Express framework.
I’ll presume you have Docker installed on your computer and have a basic understanding of Vue, Node.js, and GridDB.
You can access the complete code in this repo.
Environment setup with Docker
In my last tutorial, I explained how to set up a Node & Express API connected to GridDB. I used a Docker container as this makes it really easy to spin up GridDB on any OS.
In this tutorial, we’ll be using that Docker boilerplate again so we can quickly get started. I recommend you refer to the previous tutorial if you need to understand the setup further.
Unless you’ve followed the previous tutorial, clone this repo on your computer:
$ git clone https://github.com/anthonygore/node-griddb-docker.gitNow, enter the newly-created directory and run Docker Compose to install and launch the virtual environment:
$ cd node-griddb-docker
$ docker-compose up --build
Once that has finished installing, you will have an Express server set up and running alongside a GridDB database instance.
Confirm everything is working by making a request to the Express server using Curl
$ curl http://localhost:3000You should see the “Hello, World” message in your console.
Getting a reading of system memory
Our objective is to create an app that measures free memory on our server and makes that data available as an API.
We can easily get the amount of free memory on our server using the Node package node-os-utils.
Let’s begin by installing that:
$ npm i -S node-os-utilsWe’ll now need to restart the Docker container, as we’ve added a new NPM dependency. Use Ctrl+C to kill the current container, and then run docker build --rm . to re-build the image with the new dependency and remove the previous image. Then run docker-compose up to restart the container.
Let’s use Node OS Utils to make it so our Express API returns the amount of free memory at the path /data.
server.js
const osu = require('node-os-utils')

...

app.get('/data', async (req, res) => {
  const info = await osu.mem.info()
  res.send(info);
});
You can test this using Curl in the terminal again. This time, you’ll see stats about system memory in the response.
$ curl http://localhost:3000/data

# {"totalMemMb":1986.16,"usedMemMb":848.47,"freeMemMb":1137.69,"usedMemPercentage":42.72,"freeMemPercentage":57.28}
Interval memory readings
If we’re going to create a monitor, we want to store time-series values in a database so they can be viewed over a particular interval.
To do this, we’ll take a reading every second after our server is activated. Let’s use setInterval for this. For now, we’ll just print those values to the console.
server.js
setInterval(async() => {
  const info = await osu.mem.info();
  console.log(info.freeMemPercentage);
}, 1000);
Creating a container
How do we now get this data into our database? The first thing we’ll need to do is create a container.
To do this, we’ll define a schema for a GridDB time-series container called “FreeMemoryPercentage”. This will be a container with two columns – timestamp, which will obviously be a TIMESTAMP type, and freeMemPercentage, which will be a DOUBLE type.
We’ll then call the putContainer method of the store to create the container.
const containerName ="FreeMemoryPercentage";
const schema = new griddb.ContainerInfo({
    name: containerName,
    columnInfoList: [
    ["timestamp", griddb.Type.TIMESTAMP],
    ["freeMemPercentage", griddb.Type.DOUBLE]
  ],
    type: griddb.ContainerType.TIME_SERIES,
    rowKey: true
});
const container = await store.putContainer(schema, false);
So where do we put this code in our project? Let’s head over to our database file and create a function createContainer. Here, we’ll first attempt to retrieve the container (on the assumption it may already have been created) by calling store.getContainer.
If the container is null, we’ll create it with the code above.
With that done, we’ll call and return this method from our connect method. This allow us to pass in the store to the container and begin creating an API for database access as will be explained further below.
db.js
const createContainer = async (store) => {
  let container = await store.getContainer(containerName);
  if (container === null) {
    try {
      const schema = new griddb.ContainerInfo({
                name: containerName,
                columnInfoList: [
            ["timestamp", griddb.Type.TIMESTAMP],
            ["freeMemPercentage", griddb.Type.DOUBLE]
          ],
                type: griddb.ContainerType.TIME_SERIES,
                rowKey: true
      });
      container = await store.putContainer(schema, false);
    } catch (err) {
            console.log(err);
    }
  }
}

const connect = async () => {
  ...
  createContainer(store);
};
Store memory readings in container
We’ve now created a container for our data. How do we store free memory readings in it?
To do this, we’ll create another function in our database file, putRow. We’ll make this a higher-order function so we can automatically pass in the container without the consumer having to worry about it.
In the returned function, we’ll first create a timestamp – noting that we round it to the nearest second as seconds are the base interval – and we’ll put that timestamp, and whatever value is supplied to the function, into the container using container.put.
db.js
const putRow = (container) => async (val) => {
  try {
    const p = 1000;
    const now = new Date();
    const time = new Date(Math.round(now.getTime() / p ) * p);
    await container.put([time, val]);
  } catch (err) {
    console.log(err);
  }
}
We’re now going to return the inner function of putRow from our createContainer method so that we have a simple API that can be used by our main server file.
db.js
const createContainer = async (store) => {
  ...
  return {
    putRow: putRow(container)
  }
}
Storing memory readings from the Express server
Let’s now get access to our server container in our server file. To do this, we’ll declare a variable container but we won’t initialize it just yet.
We’ll then call the db.connect method which returns our database API. Since it’s an async function, we’ll need to wait until the promise resolves, then assign the value to the variable we just created.
server.js
let container;
db.connect().then(c => container = c);
Now, in our interval callback, we can use our API method container.putRow to store memory readings each second.
setInterval(async() => {
  const info = await osu.mem.info();
  await container.putRow(info.freeMemPercentage);
}, 1000);
Get latest readings
The next step in creating our app is to return the latest readings. To do this, we’ll go back to our database file and create another function, getLatestRows. Again, this will be a higher-order function allowing us to pass the container instance neatly.
In this function, we create a query for our GridDB container using the TQL syntax. This query will retrieve any entries where the timestamp is from the last 5 minutes.
We’ll then process each returned row and return the data in a single array.
This new method will be called from our createContainer method as well, providing another API.
db.js
const getLatestRows = (container) => async () => {
  try {
    const query = container.query(
            "select * where timestamp > TIMESTAMPADD(MINUTES, NOW(), -5)"
        );
    const rowset = await query.fetch();
    const data = [];
    while (rowset.hasNext()) {
      data.push(rowset.next());
    }
    return data;
  } catch(err) {
    console.log(err);
  }
}

const createContainer = async (store) => {
  ...
  return {
    putRow: putRow(container),
    getLatestRows: getLatestRows(container)
  }
}
Back in our server file, we can call this new method within our Express route handler and return the data.
server.js
app.get('/data', async (req, res) => {
  const rows = await container.getLatestRows();
  res.send(rows);
});
To test this you can use Curl again. You should see a block of data that is ready to be consumed by a frontend app.
$ curl http://localhost:3000/data

# [["2021-10-22T07:05:52.000Z",57.53],...]
Serving an index.html file
Let’s now begin creating a frontend app to visualize our free memory data.
We’ll first get our Express server to return an HTML document at the root path rather than a Hello, World message:
server.js
const path = require('path');

...

app.get('/', async (req, res) => {
  res.sendFile(path.join(__dirname, '/index.html'));
});
We’ll now need to create the index.html file. You can use this basic HTML boilerplate.
index.html
<!doctype html>
<html lang="en">
<head>
  <meta charset="utf-8">
  <meta name="viewport" content="width=device-width, initial-scale=1">
  <title>Server Monitor</title>
  <meta name="description" content="Node and GridDB server monitor">
</head>
<body>
</body>
</html>
I recommend you change your npm start script so that Nodemon will watch this HTML file as by default, it only watches JavaScript.
Now, as you make changes to index.html in development, the server will automatically restart.
package.json
"scripts": {
  "start": "nodemon server.js -e js,html"
},
With that done, you’ll need to kill your Docker container and restart it again using docker-compose up --build.
Now, open your browser, and go to http://localhost:3000. You should see the HTML document loaded though there won’t be any content yet.
Creating the frontend app
We’re now going to add four scripts to our HTML document head: Moment.js, Vue.js, Chart.js, and VueChart.js. These are all required to display a time-series visualization.
index.html
<head>
    ...
    <script src="https://cdnjs.cloudflare.com/ajax/libs/moment.js/2.29.1/moment.min.js"></script>
    <script src="https://cdn.jsdelivr.net/npm/vue@2.6.14"></script>
    <script src="https://cdnjs.cloudflare.com/ajax/libs/Chart.js/2.7.1/Chart.min.js"></script>
    <script src="https://unpkg.com/vue-chartjs/dist/vue-chartjs.min.js"></script>
  </head>
In the document body, create a mount element for the Vue app with ID app. Then let’s create a script tag where we’ll declare our Vue app.
index.html
<div id="app"></div>
<script type="text/javascript">
  new Vue({
    el: "#app"
  });
</script>
The first thing we’ll do in our app is retrieve the server monitor data in the mounted lifecycle hook using fetch. We’ll assign this to a data property serverData after mapping it to objects of x and y values.
index.html
new Vue({
  el: "#app",
    data: () => ({
    serverData: []
  }),
  async mounted () {
    const res = await fetch("/data");
    const data = await res.json();
    this.serverData = data.map(row => ({ x: row[0], y: row[1] }))
  }
});
Chart component
We’ll now declare a new Vue component server-monitor. This will extend the VueChartJs Line component. Give this component a prop serverData which we’ll pass in from the app shortly.
In the mounted lifecycle hook we’ll create the config necessary for VueChart.js to display a nice visualization of our time-series data.
For more information about configuring VueChart.js, see the docs.
index.html
Vue.component('server-monitor', {
    extends: VueChartJs.Line,
    props: ['serverData'],
    mounted () {
      const chartData = {
        labels: [],
          datasets: [
          {
            label: 'Free Memory %',
            backgroundColor: '#f87979',
            data: this.serverData,
            fill: false,
            borderColor: 'rgb(75, 192, 192)',
            tension: 0.1
          }
        ]
      };
      const options = {
        responsive: true,
        maintainAspectRatio: false,
        scales: {
          xAxes: [{
            type: "time",
            distribution: "linear"
          }],
          title: {
            display: false
          }
        }
      }
      this.renderChart(chartData, options)
    }
  })
Finally, we’ll declare the chart component in the app content, conditional on the server data being populated.
index.html
<div id="app">
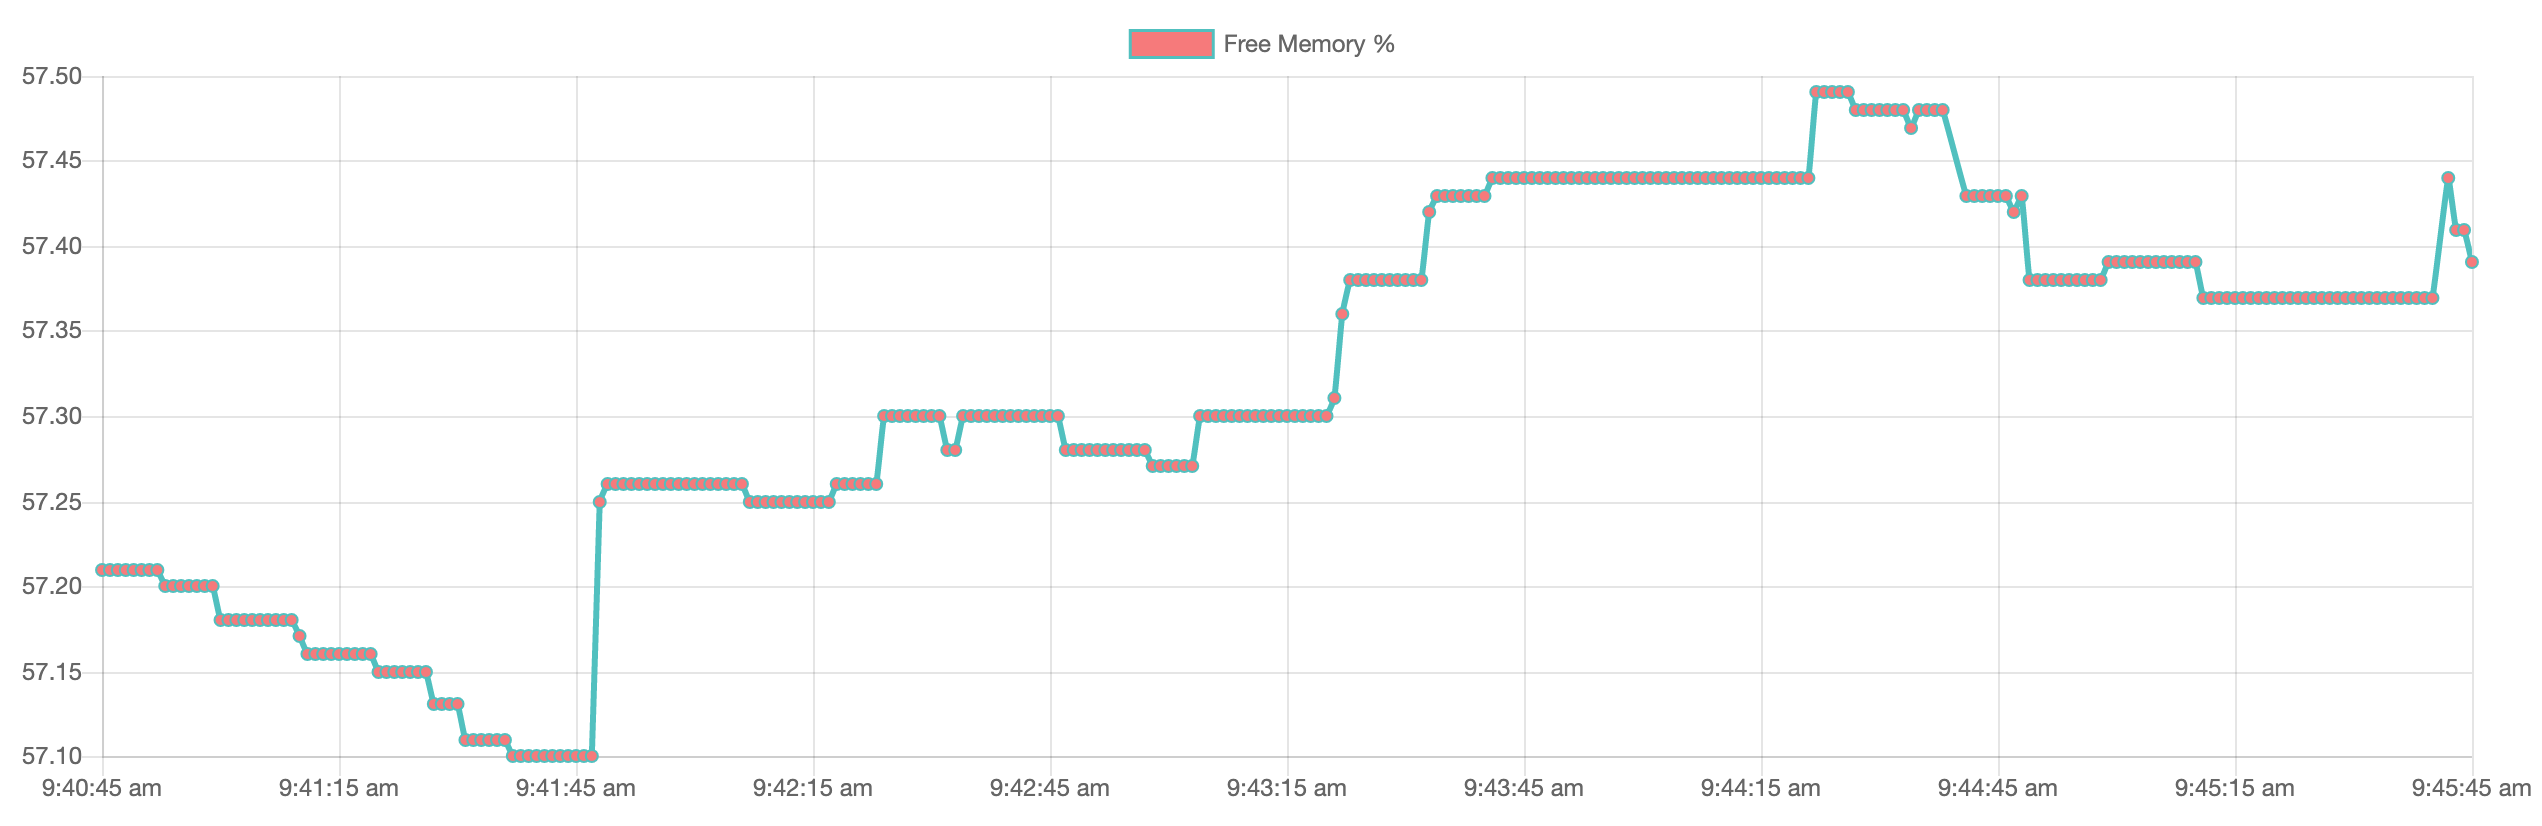
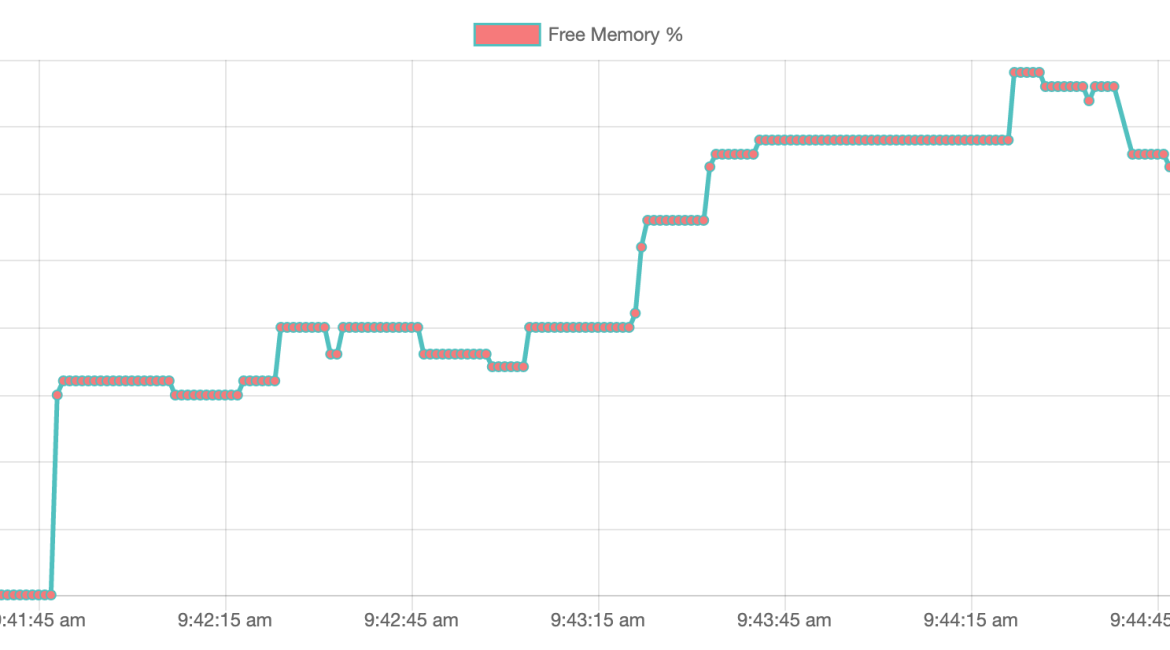
<server-monitor v-if="serverData.length" :server-data="serverData" />
</div>With that done, you should now see your server monitor rendering on the page: