
Stress significantly affects individuals’ well-being, productivity, and overall quality of life. Understanding and predicting stress levels can help take proactive measures to mitigate its adverse effects. W
This article demonstrates how to develop a stress detection system using machine learning and deep learning techniques with the GridDB database. We will begin by retrieving a stress detection dataset from Kaggle, storing it in a GridDB container, and utilizing this data to train predictive models capable of estimating users’ perceived stress scores.
GridDB, a high-performance NoSQL database, is particularly suited for managing complex and dynamic datasets. Its efficient in-memory processing and flexible data storage capabilities make it an ideal choice for real-time applications.
Note: The codes for this tutorial are in my GridDB Blogs GitHub repository.
Prerequisites
You need to install the following libraries to run codes in this article.
- GridDB C Client
- GridDB Python client
To install these libraries, follow the installation instructions on GridDB Python Package Index (Pypi).
The code is executed in Google Colab, so you do not need to install other libraries.
Run the following script to import the required libraries into your Python application.
import pandas as pd
import seaborn as sns
import matplotlib.pyplot as plt
from sklearn.model_selection import train_test_split
from sklearn.preprocessing import StandardScaler
from sklearn.metrics import mean_absolute_error, mean_squared_error
from sklearn.ensemble import RandomForestRegressor

import tensorflow as tf
from tensorflow.keras.models import Sequential
from tensorflow.keras.layers import Dense, Dropout, BatchNormalization
from tensorflow.keras.callbacks import EarlyStopping, ModelCheckpoint
from tensorflow.keras.optimizers import Adam
from tensorflow.keras.models import load_model

import griddb_python as griddb
Inserting Stress Detection Dataset into GridDB
We will begin by inserting the stress detection dataset from Kaggle into GridDB. In a later section, we will retrieve data from the GridDB and train our machine-learning algorithms for user stress prediction.
Downloading and Importing the Stress Detection Dataset from Kaggle
You can download the stress detection dataset from Kaggle and import it into your Python application.
# Dataset download link
# https://www.kaggle.com/datasets/swadeshi/stress-detection-dataset?resource=download

dataset = pd.read_csv("stress_detection.csv")
print(f"The dataset consists of {dataset.shape[0]} rows and {dataset.shape[1]} columns")
dataset.head()
Output:
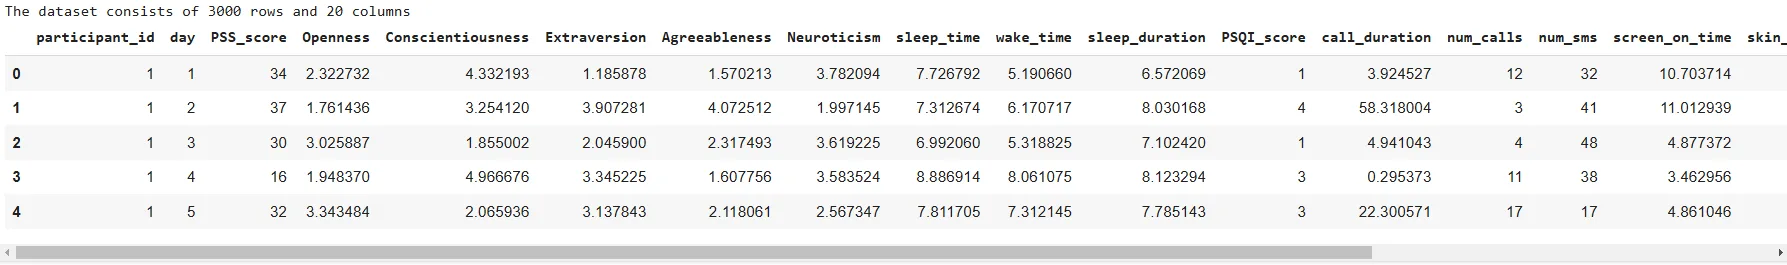
The dataset consists of 3000 records belonging to 100 users. For each user, 30 days of data are recorded for various attributes such as openness, sleep duration, screen time, mobility distance, and number of calls.
The PSS_score column contains the perceived stress score, which ranges from 10 to 40. A higher score corresponds to a higher stress level.
The following script displays various statistics for the PSS_score column.
dataset["PSS_score"].describe()Output:
count    3000.000000
mean       24.701000
std         8.615781
min        10.000000
25%        17.000000
50%        25.000000
75%        32.000000
max        39.000000
Name: PSS_score, dtype: float64
Next, we will insert the user stress dataset into GridDB.
Connect to GridDB
You need to connect to a GridDB instance before inserting data into the GridDB.
To do so, you must create a GridDB factory instance using the griddb.StoreFactory.get_instance() method.
Next, you have to call the get_store method on the factory instance and pass the database host URL, cluster name, and user name and password. The get_store() method returns a grid store object that you can use to create containers in GridDB.
To test whether the connection is successful, we retrieve a dummy container, container1, as shown in the script below.
# GridDB connection details
DB_HOST = "127.0.0.1:10001"
DB_CLUSTER = "myCluster"
DB_USER = "admin"
DB_PASS = "admin"

# creating a connection

factory = griddb.StoreFactory.get_instance()

try:
    gridstore = factory.get_store(
        notification_member = DB_HOST,
        cluster_name = DB_CLUSTER,
        username = DB_USER,
        password = DB_PASS
    )

    container1 = gridstore.get_container("container1")
    if container1 == None:
        print("Container does not exist")
    print("Successfully connected to GridDB")

except griddb.GSException as e:
    for i in range(e.get_error_stack_size()):
        print("[", i, "]")
        print(e.get_error_code(i))
        print(e.get_location(i))
        print(e.get_message(i))
Output:
Container does not exist
Successfully connected to GridDB
You should see the above message if the connection is successful.
Create Container for User Stress Data in GridDB
GridDB stores data in containers, which are specialized data structures for efficient data structure.
The following script creates a GridDB container to store our stress detection dataset.
We first remove any existing container with the name user_stress_data as we will use this name to create a new container.
Next, we replace empty spaces in column names with an underscore since GridDB does not expect column names to have spaces.
We will then map Pandas DataFrame data type to GridDB data types and create a column info list containing column names and corresponding GridDB data types,
Next, we create a container info object and pass it the container name, the column info list, and the container type, which is COLLECTION for tabular data.
Finally, we call the grid store’s put_container method and pass the container info object we created to it as a parameter.
# drop container if already exists
gridstore.drop_container("user_stress_data")

# Clean column names to remove spaces or forbidden characters in the GridDB container
dataset.columns = [col.strip().replace(" ", "_") for col in dataset.columns]


# Mapping from pandas data types to GridDB data types
type_mapping = {
    'float64': griddb.Type.DOUBLE,
    'int64': griddb.Type.INTEGER,
    'object': griddb.Type.STRING,
    'category': griddb.Type.STRING  # Map category to STRING for GridDB
}


# Generate column_info dynamically
column_info = [[col, type_mapping[str(dtype)]] for col, dtype in dataset.dtypes.items()]

# Define the container info
container_name = "user_stress_data"
container_info = griddb.ContainerInfo(
    container_name, column_info, griddb.ContainerType.COLLECTION, row_key=True
)

# Connecting to GridDB and creating the container
try:
    gridstore.put_container(container_info)
    container = gridstore.get_container(container_name)
    if container is None:
        print(f"Failed to create container: {container_name}")
    else:
        print(f"Successfully created container: {container_name}")

except griddb.GSException as e:
    print(f"Error creating container {container_name}:")
    for i in range(e.get_error_stack_size()):
        print(f"[{i}] Error code: {e.get_error_code(i)}, Message: {e.get_message(i)}")
Output:
Successfully created container: user_stress_dataThe above message shows that the container creation is successful.
Insert User Stress Data into GridDB
We can now store data in the container we created.
To do so, we iterate through the rows in our dataset, convert the column data into a GridDB data type, and store each row in the container using the put() method.
The following script inserts our stress detection dataset into the user_stress_data container we created.
try:
    for _, row in dataset.iterrows():
        # Prepare each row's data in the exact order as defined in `column_info`
        row_data = [
            int(row[col]) if dtype == griddb.Type.INTEGER else
            float(row[col]) if dtype == griddb.Type.DOUBLE else
            str(row[col])
            for col, dtype in column_info
        ]
        # Insert the row data into the container
        container.put(row_data)

    print(f"Successfully inserted {len(dataset)} rows of data into {container_name}")

except griddb.GSException as e:
    print(f"Error inserting data into container {container_name}:")
    for i in range(e.get_error_stack_size()):
        print(f"[{i}] Error code: {e.get_error_code(i)}, Message: {e.get_message(i)}")
Output:
Successfully inserted 3000 rows of data into user_stress_dataThe above output shows that data insertion is successful.
Stress Detection Using Machine and Deep Learning
In this section, we will retrieve the stress detection dataset from the user_stress_data GridDB container we created earlier. Subsequently, we will train machine learning and deep learning models for stress prediction.
Retrieving Data from GridDB
The following script defines the retrieve_data_from_griddb() function that accepts the container name as a parameter and calls the get_container() function on the grid store to retrieve the data container.
Next, we create a SELECT query object and call its fetch() method to retrieve all records from the user_stress_data container. Finally, we call the fetch_rows() function to convert the records into a Pandas DataFrame.
def retrieve_data_from_griddb(container_name):

    try:
        data_container = gridstore.get_container(container_name)

        # Query all data from the container
        query = data_container.query("select *")
        rs = query.fetch()

        data = rs.fetch_rows()
        return data

    except griddb.GSException as e:
        print(f"Error retrieving data from GridDB: {e.get_message()}")
        return None


stress_dataset = retrieve_data_from_griddb("user_stress_data")
stress_dataset.head()
Output:
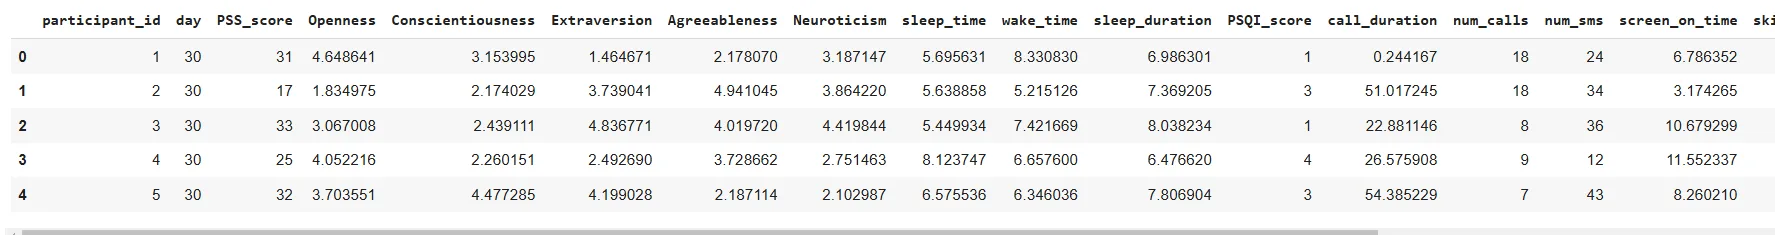
The above output shows the stress detection dataset we retrieved from the GridDB container.
Predicting User Stress with Machine Learning
We will first try to predict the PSS_score using a traditional machine learning algorithm such as Random Forest Regressor.
The following script divides the dataset into features and labels, splits it into training and test sets, and normalizes it using the standard scaling approach.
X = stress_dataset.drop(columns=['PSS_score'])
y = stress_dataset['PSS_score']

X_train, X_test, y_train, y_test = train_test_split(X, y, test_size=0.2, random_state=42)

scaler = StandardScaler()
X_train = scaler.fit_transform(X_train)
X_test = scaler.transform(X_test)
Next, we create an object of the RandomForestRegressor class from he Scikit learn library and pass the training and test sets to the fit() method.
rf_model = RandomForestRegressor(random_state=42, n_estimators=1000)
rf_model.fit(X_train, y_train)
Finally, we evaluate the model performance by prediting PSS_score on the test set.
rf_predictions = rf_model.predict(X_test)

# Evaluate the regression model
mae = mean_absolute_error(y_test, rf_predictions)

print(f"Mean Absolute Error: {mae:.4f}")
Output:
Mean Absolute Error: 7.8973The output shows that, on average, our model’s predicted PSS_score is off by 7.8 points. This is not so bad, but it is not very good either.
Next, we will develop a deep neural network for stress detection prediction.
Predicting User Stress with Deep Learning
We will use the TensorFlow and Keras libraries to create a sequential deep learning model with three dense layers. We will also add batch normalization and dropout to reduce model overfitting.
We will also use an adaptive learning rate so the gradient doesn’t overshoot while training.
Finally, we compile the model using the mean squared error loss and mean absolute error metric. We use this loss and metric since we are dealing with a regression problem.
model = Sequential([
    Dense(128, input_dim=X_train.shape[1], activation='relu'),
    BatchNormalization(),
    Dropout(0.2),
    Dense(64, activation='relu'),
    BatchNormalization(),
    Dropout(0.2),
    Dense(32, activation='relu'),
    BatchNormalization(),
    Dropout(0.1),
    Dense(1)
])

# Adaptive learning rate scheduler with exponential decay
initial_learning_rate = 0.001
lr_schedule = tf.keras.optimizers.schedules.ExponentialDecay(
    initial_learning_rate=initial_learning_rate,
    decay_steps=10000,
    decay_rate=0.9
)

# Compile the model with Adam optimizer and a regression loss
model.compile(optimizer=Adam(learning_rate=lr_schedule),
              loss='mean_squared_error',
              metrics=['mean_absolute_error'])

# Summary of the model
model.summary()
Output:
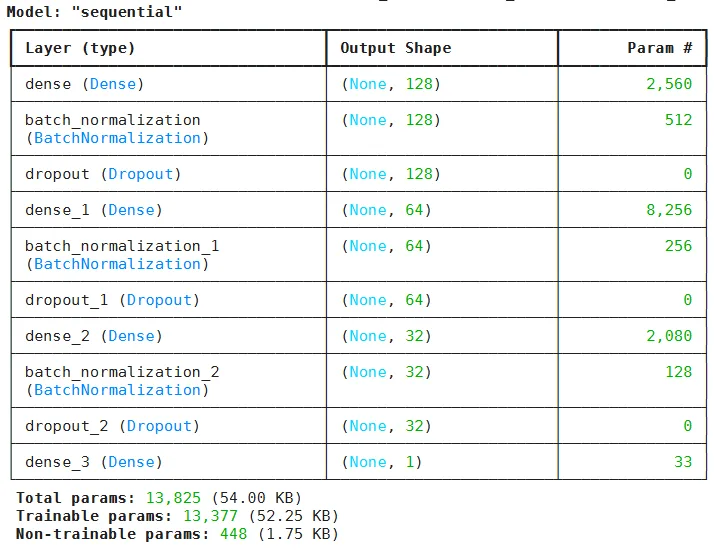
The above output shows the model summary.
Next, we train the model using the fit() method. We use an early stopping approach that stops model training if the loss doesn’t decrease for 100 consecutive epochs. Finally, we save the best model at the end of model training.
# Define callbacks for training
early_stopping = EarlyStopping(monitor='val_loss', patience=100, restore_best_weights=True)
model_checkpoint = ModelCheckpoint('best_model.keras', monitor='val_loss', save_best_only=True)

# Train the model with the callbacks
history = model.fit(
    X_train, y_train,
    epochs=1000,
    batch_size=4,
    validation_data=(X_test, y_test),
    callbacks=[early_stopping, model_checkpoint],
    verbose=1
)
Output:
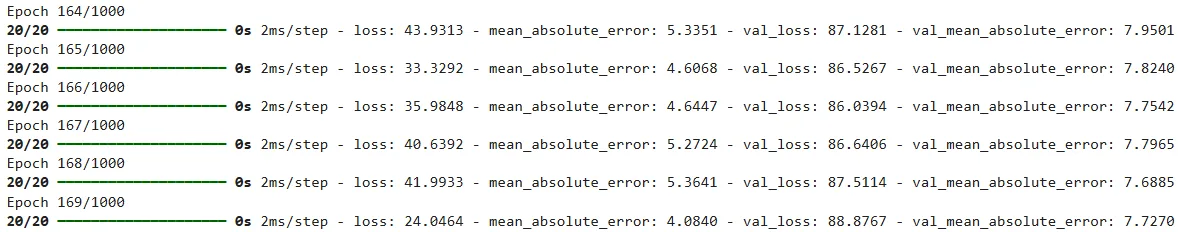
We load the best model to evaluate the performance and use it to make predictions on the test set.
# Load the best model
best_model = load_model('best_model.keras')

# Make predictions on the test set
y_pred = best_model.predict(X_test)

# Calculate Mean Absolute Error
mae = mean_absolute_error(y_test, y_pred)
print(f"Mean Absolute Error: {mae:.4f}")

# Plot training history to show MAE over epochs
plt.plot(history.history['mean_absolute_error'], label='Train MAE')
plt.plot(history.history['val_mean_absolute_error'], label='Validation MAE')
plt.title('Mean Absolute Error over Epochs')
plt.xlabel('Epochs')
plt.ylabel('MAE')
plt.legend()
plt.show()
Output:
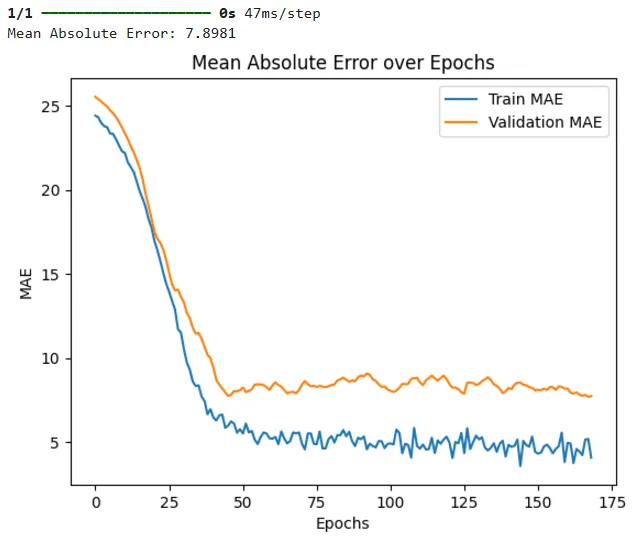
On the test set, we achieved a mean absolute error value of 7.89, similar to what we achieved using the Random Forest Regressor. The results also show that our model is slightly overfitting since the training loss is lower compared to validation loss across the epochs.
Conclusion
This article is a comprehensive guide to developing a stress detection system using machine learning, deep learning regression models, and the GridDB database.
In this article, you explored the process of connecting to GridDB, inserting a stress detection dataset, and utilizing Random Forest and deep neural networks to predict perceived stress scores. The Random Forest and deep learning models performed decently with a manageable mean absolute error.
If you have any questions or need assistance with GridDB or machine learning techniques, please ask on Stack Overflow using the griddb tag. Our team is always happy to help.
For the complete code, visit my GridDB Blogs GitHub repository.
If you have any questions about the blog, please create a Stack Overflow post here https://stackoverflow.com/questions/ask?tags=griddb .
Make sure that you use the “griddb” tag so our engineers can quickly reply to your questions.