Introduction and Purpose
The Use Case
This article continues the series on building a Python-based real-time reporting tool for IoT data. As in the first article of this series, we use IoT connectivity data. The dataset contains timestamps, events, sim card IDs, and data usage. This data is typically sent by the IoT devices in the background to let the support engineers do monitoring and timely troubleshooting.
The full source code for this project can be found at the bottom of this page: FULL SOURCE CODE
The Objectives
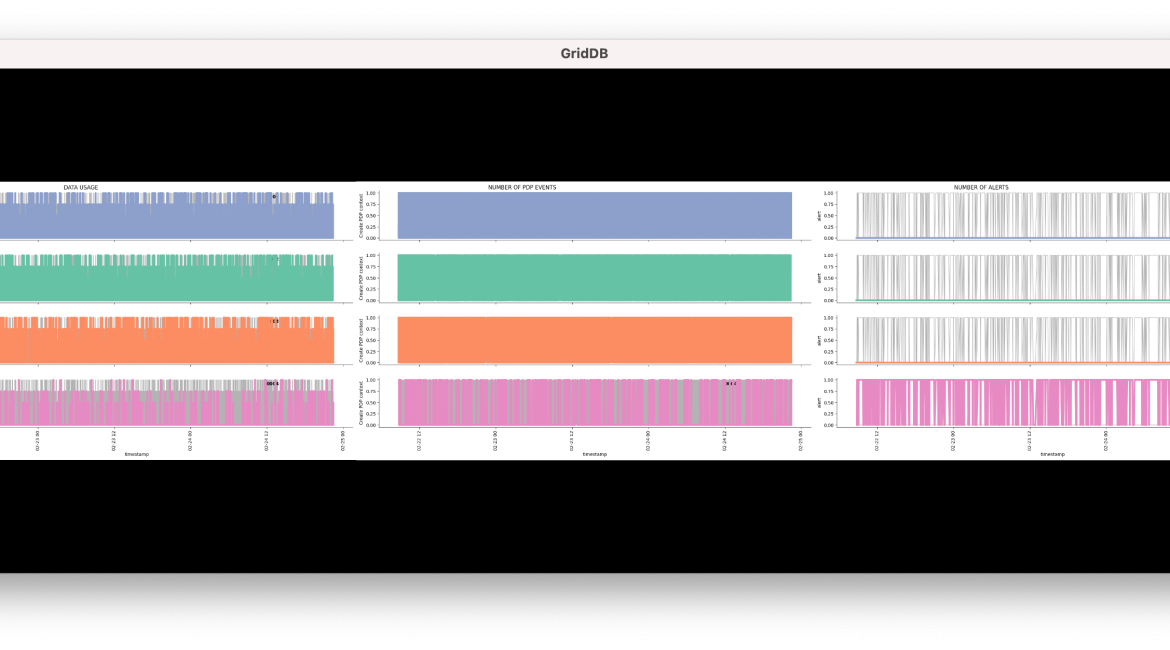
In the previous article, we built a real-time dashboard that pulls data from the GridDB database and refreshes data visualizations automatically. In this article, we will build a simple application with Python’s kivy package. It will be a board that incorporates the same charts and performs the automatic refresh in the background, without the user’s participation.
Thus, the objectives are: * build a simple user interface * integrate the existing code
As a result, you will have a .PY file that you can run from a code editor supporting Python, such as Visual Studio Code. In the next article – the last one in this cycle – we will finalize the application to make it completely independent and able to run on any machine.
Prerequisites
As already mentioned, you will need a code editor or a Python IDE to run the code we will be working on in this article. We strongly recommend using Visual Studio Code: It helps to organize your coding project by keeping all drafts and supplementary files in one place.
Main Part
Building a user interface in kivy is very similar to playing a Russian doll called matryoshka. It is a wooden figurine containing another figurine, and then another one, and then one more figurine, and so on, and so on, until you discover the last figurine which is the smallest one.
In kivy, the app is the same: you have a screen manager that manages screens. In their turn, screens contain layouts: organized spaces with placeholders for widgets. Widgets are the smallest components that contain only one single element, such as text, image, or button.
In kivy, you create single components and assemble them into an application, following the reverse order, taking first the smallest and then the biggest ones.
Layout
As with any programming code, when you write a command you have to refer to something that already exists. For this reason, we do not start with the highest level in the hierarchy – the screen manager – but rather the other way around. We would have started with creating the image widgets, but we already have the code: the one we created in the previous tutorial. Since we have to schedule the image object refresh, we need to place this chunk of code into the main application. The main application will be created at the very end.
Thus, we first create a layout.
from kivy.uix.boxlayout import BoxLayout
global layout
layout = BoxLayout(orientation='horizontal')
BoxLayout() is the easiest way to create a layout. It has fewer parameters and is less flexible, but saves you a few lines of code if you are not building anything complicated.
You can switch between a horizontal and a vertical layout by adjusting the orientation argument.
We save the layout as a global variable since we are going to use it outside of its context, in the main application loop.
Screen
Now we can create our only screen and place the layout on it. Add_widget() is kivy’s universal function for adding widgets and layouts to their parent elements.
from kivy.uix.screenmanager import Screen
ChartScr = Screen()
ChartScr.add_widget(layout)
Screen Manager
Before proceeding to the main application loop, we wrap the previous component into another layer: the screen manager.
from kivy.uix.screenmanager import NoTransition, ScreenManager
sm = ScreenManager()
sm.add_widget(ChartScr)
Main Application
The basic way of building an app in kivy is the following. We declare our application as a class, create a function that returns the screen manager, and tell the application to run.
from kivy.app import App
class GridDBApp(App):
    def build(self):
        return sm
GridDBApp().run()
Since we want our application to do more than that, we need to create a few more functions: * a function that renders PNG pictures * a function that fills the layout with pictures * a function that clears the layout before adding newly rendered pictures * three functions that schedule a refresh: one per each function above
They must be placed after the build function that creates the main application and before the app().run() command that brings the whole app in motion.
Rendering Three PNG Pictures
Here goes the code from the preparation part: The one we worked on in the previous blog post.
A few minor preparation steps, such as transforming data formats and cleaning the string column, are necessary, but may vary depending on your individual setup. The goal is to have the following data frame structured as the one below:
iotdf.head()
| timestamp | event | simid | data_usage | |
|---|---|---|---|---|
| 0 | 2021-02-22 08:42:47.789297 | Create PDP context | 0002 | 0.00 |
| 1 | 2021-02-22 08:42:48.789297 | data | 0002 | 0.04 |
| 2 | 2021-02-22 08:42:49.789297 | Delete PDP context | 0002 | 0.00 |
| 3 | 2021-02-22 08:43:36.789297 | Create PDP context | 0003 | 0.00 |
| 4 | 2021-02-22 08:43:37.789297 | data | 0003 | 0.03 |
iotdf.info()
<class 'pandas.core.frame.DataFrame'>
RangeIndex: 13086 entries, 0 to 13085
Data columns (total 4 columns):
 #   Column      Non-Null Count  Dtype
---  ------      --------------  -----
 0   timestamp   13086 non-null  datetime64[ns]
 1   event       13086 non-null  object
 2   simid       13086 non-null  object
 3   data_usage  13086 non-null  float64
dtypes: datetime64[ns](1), float64(1), object(2)
memory usage: 409.1+ KB
Contrary to all other changes, the next two will be inherited by the final application.
First, as you remember, in the previous tutorial we used the WHILE loop to enable dashboard refresh in Jupyter Notebook or a Python IDE. In kivy, we will use a better alternative, so we abandon the WHILE loop, too.
Second, we do not need to show the charts with plt.show() anymore. Instead, we need to save them with the savefig() function. Due to this last change, we will remove a few packages from the script, since they only made sense when working with Jupyter Notebook.
Apart from this, the code that builds the dashboard remains the same.
def renderPng(self):


    # Load up data from your GridDB server
    conn = jaydebeapi.connect("com.toshiba.mwcloud.gs.sql.Driver",
                           "jdbc:gs://griddb:20001/defaultCluster/public?notificationMember:127.0.0.1:20001",
                           ["admin", "admin"],
                          "/usr/share/java/gridstore-jdbc-4.5.0.jar",)

    curs = conn.cursor()

    #querying the data for the last hour
    iot = ('''SELECT
    TIMESTAMP(timestamp) as timestamp,
    event, simid, data_usage
    FROM IoT
    WHERE TIMESTAMP(timestamp) > TIMESTAMP_ADD(HOUR, NOW(), -1)''')
    iotdf = pd.read_sql_query(iot, conn)

    iotdf['timestamp']= iotdf['timestamp'].apply(pd.to_datetime)
    iotdf['simid'] = iotdf['simid'].apply(lambda x: '000' + str(x))
    iotdf[iotdf['timestamp'] > (datetime.now() + timedelta(minutes = 20))]

    # as in the previous article
    pivotdf = iotdf.pivot_table(index=['timestamp', 'simid', 'data_usage'],
                                    columns='event',
                                    values= 'event',
                                    aggfunc=lambda x: 1)
    pivotdf = pivotdf.reset_index()
    pivotdf = pivotdf.fillna(0)

    #data visualization
    order = ['0001', '0002', '0003', '0004']


    #data usage
    g = sns.relplot(
    data=pivotdf,
    x="timestamp", y="data_usage", col="simid", hue="simid",col_order = ['0001', '0002', '0003', '0004'],
    kind="line", palette="Set2", linewidth=4, zorder=5,
    col_wrap=1, height=2, aspect=7, legend=False,
    )

    for simid, ax in g.axes_dict.items():


        ax.text(.8, .85, simid, transform=ax.transAxes, fontweight="bold")


        sns.lineplot(
            data=pivotdf, x="timestamp", y="data_usage", units="simid",
            estimator=None, color=".7", linewidth=1, ax=ax,
        )

    ax.set_xticks(ax.get_xticks()[::1])
    g.set_xticklabels(rotation=90)

    g.set_titles("")
    g.fig.suptitle('DATA USAGE                   ', horizontalalignment = 'right')

    g.savefig('png1.png')

    #number of pdp events
    g = sns.relplot(
    data=pivotdf,
    x="timestamp", y="Create PDP context", col="simid", hue="simid",col_order = ['0001', '0002', '0003', '0004'],
    kind="line", palette="Set2", linewidth=4, zorder=5,
    col_wrap=1, height=2, aspect=7, legend=False,
    )

    for simid, ax in g.axes_dict.items():


        ax.text(.8, .85, simid, transform=ax.transAxes, fontweight="bold")


        sns.lineplot(
            data=pivotdf, x="timestamp", y="Create PDP context", units="simid",
            estimator=None, color=".7", linewidth=1, ax=ax,
        )

    ax.set_xticks(ax.get_xticks()[::1])
    g.set_xticklabels(rotation=90)

    g.set_titles("")
    g.fig.suptitle('NUMBER OF PDP EVENTS                   ', horizontalalignment = 'right')

    g.savefig('png2.png')

    #alerts
    g = sns.relplot(
    data=pivotdf,
    x="timestamp", y="alert", col="simid", hue="simid",col_order = ['0001', '0002', '0003', '0004'],
    kind="line", palette="Set2", linewidth=4, zorder=5,
    col_wrap=1, height=2, aspect=7, legend=False,
    )

    for simid, ax in g.axes_dict.items():


        ax.text(.8, .85, simid, transform=ax.transAxes, fontweight="bold")


        sns.lineplot(
            data=pivotdf, x="timestamp", y="alert", units="simid",
            estimator=None, color=".7", linewidth=1, ax=ax,
        )

    ax.set_xticks(ax.get_xticks()[::1])
    g.set_xticklabels(rotation=90)

    g.set_titles("")
    g.fig.suptitle('NUMBER OF ALERTS                      ', horizontalalignment = 'right')

    g.savefig('png3.png')

    print('saved pictures')
Directly below the function definition, we schedule this function to repeat itself every X seconds.
from kivy.clock import Clock
Clock.schedule_interval(renderPng, 10)
Removing Existing Widgets
If we do not include this function, the app will be putting each newly created picture above the existing ones. You will still see only the last ones that you need, but we do not want to exhaust the patience of the application.
We schedule a cleanup of our layout with only three lines of code.
def clearLayout(self):
    layout.clear_widgets()
Clock.schedule_interval(clearLayout, 10)
Adding Fresh Visualizations
The renderPng() function only saves the pictures in the same directory (folder) where you also save the .PY file. We still need to add them to the layout.
We define a function for this and use a FOR loop to avoid writing the same statement three times. It also makes the code more flexible: if you need more charts, you add thme in the renderPng() and increase the range in the FOR loop here.
Removing previously saved pictures
In this function, we also need to add a statement that removes all previously rendered pictures to protect the memory capacities and avoid filling it with the pictures we do not need anymore. Since the statement can only work when there are some pictures already saved, we add the try/except pair to prevent error messages. If no pictures have been rendered so far, the statement will be skipped.
You need this to start the application for the very first time, or if for any other reason you have no previously saved pictures in the directory.
Last but not least, this function needs to be scheduled to run repeatedly.
import os

def buildLayout(self):

    for i in range(1,4):
        layout.add_widget(Image(source = 'png' + str(i) + '.png'))
        print('replaced pictures')

    try:
        for i in range(1,4):
            os.remove('png' + str(i) + '.png')
            print('done')
    except:
        pass

Clock.schedule_interval(buildLayout, 10)
The Final Code
As we mentioned before, all functions go inside the main application loop.
We also put all import [package] commands in the very beginning to have a better overview of them.
Eventually, the code we get looks like this:
from kivy.app import App

from kivy.uix.screenmanager import NoTransition, ScreenManager, Screen
from kivy.uix.image import Image
from kivy.clock import Clock
from kivy.uix.boxlayout import BoxLayout

from datetime import datetime, timedelta
import pandas as pd
import time
import seaborn as sns
import matplotlib.pyplot as plt

import os

global layout
layout = BoxLayout(orientation='horizontal')

ChartScr = Screen()
ChartScr.add_widget(layout)
sm = ScreenManager()
sm.add_widget(ChartScr)


class GridDBApp(App):

    def build(self):
        return sm

    def renderPng(self):

        # Load up data from your GridDB server
        conn = jaydebeapi.connect("com.toshiba.mwcloud.gs.sql.Driver",
                            "jdbc:gs://griddb:20001/defaultCluster/public?notificationMember:127.0.0.1:20001",
                            ["admin", "admin"],
                            "/usr/share/java/gridstore-jdbc-4.5.0.jar",)

        curs = conn.cursor()

        #querying the data for the last hour
        iot = ('''SELECT
        TIMESTAMP(timestamp) as timestamp,
        event, simid, data_usage
        FROM IoT
        WHERE TIMESTAMP(timestamp) > TIMESTAMP_ADD(HOUR, NOW(), -1)''')

        iotdf = pd.read_sql_query(iot, conn)
        iotdf['timestamp']= iotdf['timestamp'].apply(pd.to_datetime)
        iotdf['simid'] = iotdf['simid'].apply(lambda x: '000' + str(x))
        iotdf[iotdf['timestamp'] > (datetime.now() + timedelta(minutes = 20))]

        # as in the previous article
        pivotdf = iotdf.pivot_table(index=['timestamp', 'simid', 'data_usage'],
                                        columns='event',
                                        values= 'event',
                                        aggfunc=lambda x: 1)
        pivotdf = pivotdf.reset_index()
        pivotdf = pivotdf.fillna(0)

        #data visualization
        order = ['0001', '0002', '0003', '0004']


        #data usage
        g = sns.relplot(
        data=pivotdf,
        x="timestamp", y="data_usage", col="simid", hue="simid",col_order = ['0001', '0002', '0003', '0004'],
        kind="line", palette="Set2", linewidth=4, zorder=5,
        col_wrap=1, height=2, aspect=7, legend=False,
        )

        for simid, ax in g.axes_dict.items():


            ax.text(.8, .85, simid, transform=ax.transAxes, fontweight="bold")


            sns.lineplot(
                data=pivotdf, x="timestamp", y="data_usage", units="simid",
                estimator=None, color=".7", linewidth=1, ax=ax,
            )

        ax.set_xticks(ax.get_xticks()[::1])
        g.set_xticklabels(rotation=90)

        g.set_titles("")
        g.fig.suptitle('DATA USAGE                   ', horizontalalignment = 'right')

        g.savefig('png1.png')

        #number of pdp events
        g = sns.relplot(
        data=pivotdf,
        x="timestamp", y="Create PDP context", col="simid", hue="simid",col_order = ['0001', '0002', '0003', '0004'],
        kind="line", palette="Set2", linewidth=4, zorder=5,
        col_wrap=1, height=2, aspect=7, legend=False,
        )

        for simid, ax in g.axes_dict.items():


            ax.text(.8, .85, simid, transform=ax.transAxes, fontweight="bold")


            sns.lineplot(
                data=pivotdf, x="timestamp", y="Create PDP context", units="simid",
                estimator=None, color=".7", linewidth=1, ax=ax,
            )

        ax.set_xticks(ax.get_xticks()[::1])
        g.set_xticklabels(rotation=90)

        g.set_titles("")
        g.fig.suptitle('NUMBER OF PDP EVENTS                   ', horizontalalignment = 'right')

        g.savefig('png2.png')

        #alerts
        g = sns.relplot(
        data=pivotdf,
        x="timestamp", y="alert", col="simid", hue="simid",col_order = ['0001', '0002', '0003', '0004'],
        kind="line", palette="Set2", linewidth=4, zorder=5,
        col_wrap=1, height=2, aspect=7, legend=False,
        )

        for simid, ax in g.axes_dict.items():


            ax.text(.8, .85, simid, transform=ax.transAxes, fontweight="bold")


            sns.lineplot(
                data=pivotdf, x="timestamp", y="alert", units="simid",
                estimator=None, color=".7", linewidth=1, ax=ax,
            )

        ax.set_xticks(ax.get_xticks()[::1])
        g.set_xticklabels(rotation=90)

        g.set_titles("")
        g.fig.suptitle('NUMBER OF ALERTS                      ', horizontalalignment = 'right')

        g.savefig('png3.png')

        print('saved pictures')

    Clock.schedule_interval(renderPng, 10)

    def clearLayout(self):
        layout.clear_widgets()
    Clock.schedule_interval(clearLayout, 10)

    def buildLayout(self):

        for i in range(1,4):
            layout.add_widget(Image(source = 'png' + str(i) + '.png'))
            print('replaced pictures')

        try:
            for i in range(1,4):
                os.remove('png' + str(i) + '.png')
                print('done')
        except:
            pass

    Clock.schedule_interval(buildLayout, 10)


GridDBApp().run()
A Few Notes: Possible Troubleshooting
- If your code editor throws “no module found” error:
You may need to install seaborn or any other missing package with a pip or sudo command. Even if seaborn is installed in your Jupyter Notebook, it is not yet installed on your PC or Mac. If this is the case, your code editor will be asking you to install it again. You can do this in terminal. Usually, you use pip, but sometimes, with a Mac, you’ll need to use pip3.
pip install seaborn
- If you (or the application) cannot find the . PNG pictures:
When using Visual Studio Code, make sure that you open the workspace and not the single files. This will attach the directory to the project you are working on and everything generated by the code will be saved in the same directory (folder).