
Energy is one of the most crucial factors for a wide range of businesses, and the abrupt increase in fuel prices has had an effect on the global economy. Energy costs significantly contribute to the decades-high inflation rates being observed as prices for a variety of goods and services rise. Gas prices fluctuate with the price of crude oil, though not always promptly or to the same degree. Oil is a commodity that is traded globally, so supply and demand on a global level primarily determine its price. When supply outpaces demand, prices fall. In contrast, when demand outpaces supply, prices rise.
Fuel demand fell during COVID-19 because all businesses were shut down, but it has suddenly increased since the pandemic-related reopening of industries around the world. On the other hand, the situation got worse after Russia invaded Ukraine. Since, Russia is the world’s largest producer and exporter of oil, and because the United States of America, Canada, and many other nations forbade Russia’s import, fuel prices suddenly increased across the board.
In this article, we will examine fuel prices and its demand globally using the recent dataset through GridDB.
Exporting and Importing Dataset Using GridDB
GridDB is a highly scalable and optimized in-memory No SQL database that allows parallel processing for higher performance and efficiency, especially for time-series databases. We will be using GridDB’s node js client, which allows us to connect GridDB to node js and import or export data in real-time.
These are the columns that we would be using in our analysis:
- Country: Name of the countries – Primary key of our database.
- Daily Oil Consumption (Barrels): The number of oil barrels required for for daily consumption for each country.
- World Share: Percentage of oil consumption for each country.
- Yearly Gallons Per Capita: Number of gallons per year pe capita.
- Price Per Gallon (USD): Price per gallon in US Dollars.
- Price Per Liter (USD): Price per liter in US Dollars.
- Price Per Liter (PKR): Price per liter in Pakistani Rupees.
To upload the dataset to GridDB, we would read the CSV file that contains the data which is taken from Kaggle
Now, we will create a GridDB container to pass our database schema to the GridDB to be able to generate the design of the database before inserting the row information. Next, we would insert our data into the GridDB. We have now successfully exported the dataset to the GridDB platform.
On the other hand, to import the dataset from the GridDB platform, we will use TQL, GridDB’s query language similar to SQL. We will create a container and store the fetched data in it. The next step would be to extract the rows in order of the column info and save it into a data frame to use for data visualization and analysis.
var griddb =  require('griddb_node');

const createCsvWriter = require('csv-writer').createObjectCsvWriter;
const csvWriter = createCsvWriter({
  path: 'out.csv',
  header: [
      {id: "country", title: "country"},
      {id: "daily oil consumption (barrels)", title: "daily oil consumption (barrels)"},
      {id: "world share", title: "world share"},
      {id: "yearly gallons per capita", title: "yearly gallons per capita"},
      {id: "price per gallon (USD)", title: "price per gallon(USD)"},
      {id: "price per liter (USD)", title: "price per liter (USD)"},
      {id: "price per liter (PKR)", title: "price per liter (PKR)"}
  ]
});

const factory = griddb.StoreFactory.getInstance();
const store = factory.getStore({
    "host": '239.0.0.1',
    "port": 31999,
    "clusterName": "defaultCluster",
    "username": "admin",
    "password": "admin"
});

const conInfo = new griddb.ContainerInfo({
    'name': "globalfluctuationsfuelprices",
    'columnInfoList': [
      ["country", griddb.Type.STRING],
      ["daily oil consumption (barrels)", griddb.Type.INTEGER],
      ["world share", griddb.Type.STRING],
      ["yearly gallons per capita", griddb.Type.DOUBLE],
      ["price per gallon (USD)", griddb.Type.DOUBLE],
      ["price per liter (USD)", griddb.Type.DOUBLE],
      ["price per liter (PKR)", griddb.Type.DOUBLE]
    ],
    'type': griddb.ContainerType.COLLECTION, 'rowKey': true
});

const csv = require('csv-parser');

const fs = require('fs');
var lst = []
var lst2 = []
var i =0;
fs.createReadStream('./dataset/Petrol Dataset June 20 2022.csv')
  .pipe(csv())
  .on('data', (row) => {
    lst.push(row);
  })
  .on('end', () => {

    var container;
    var idx = 0;

    for(let i=0;i<lst.length;i++){

        lst[i]['daily oil consumption (barrels)'] = parseInt(lst[i]["daily oil consumption (barrels)"])
        lst[i]['yearly gallons per capita'] = parseFloat(lst[i]["yearly gallons per capita"])
        lst[i]['price per gallon(USD)'] = parseFloat(lst[i]["price per gallon (USD)"])
        lst[i]['price per liter (USD)'] = parseFloat(lst[i]["price per liter (USD)"])
        lst[i]['price per liter (PKR)'] = parseFloat(lst[i]["price per liter (PKR)"])


        console.log(parseFloat(lst[i]["country"]))
    store.putContainer(conInfo, false)
        .then(cont => {
            container = cont;
            return container.createIndex({ 'columnName': 'name', 'indexType': griddb.IndexType.DEFAULT });
        })
        .then(() => {
            idx++;
            container.setAutoCommit(false);
            return container.put([String(idx), lst[i]['country'],lst[i]["daily oil consumption (barrels)"],lst[i]["world share"],lst[i]["yearly gallons per capita"],lst[i]["price per gallon (USD)"],lst[i]["price per liter(USD)"],lst[i]["price per liter (PKR)"]]);
        })
        .then(() => {
            return container.commit();
        })

        .catch(err => {
            if (err.constructor.name == "GSException") {
                for (var i = 0; i < err.getErrorStackSize(); i++) {
                    console.log("[", i, "]");
                    console.log(err.getErrorCode(i));
                    console.log(err.getMessage(i));
                }
            } else {
                console.log(err);
            }
        });

    }


    store.getContainer("globalfluctuationsfuelprices")
    .then(ts => {
        container = ts;
      query = container.query("select *")
      return query.fetch();
  })
  .then(rs => {
      while (rs.hasNext()) {

          console.log(rs.next())
          lst2.push(

                {
                    'country': rs.next()[1],
                    "daily oil consumption (barrels)": rs.next()[2],
                    "world share": rs.next()[3],
                    "yearly gallons per capita": rs.next()[4],
                    "price per gallon (USD)": rs.next()[5],
                    "price per liter (USD)": rs.next()[6],
                    "price per liter (PKR)": rs.next()[7]
                }
          );

      }
      console.log(lst2)

        csvWriter
        .writeRecords(lst2)
        .then(()=> console.log('The CSV file was written successfully'));

      return
  }).catch(err => {
      if (err.constructor.name == "GSException") {
          for (var i = 0; i < err.getErrorStackSize(); i++) {
              console.log("[", i, "]");
              console.log(err.getErrorCode(i));
              console.log(err.getMessage(i));
          }
      } else {
          console.log(err);
      }
  });

  console.log(lst2);

  });
Data Analysis
In order to obtain a basic understanding of fuel prices and consumption globally in relation to each of the mentioned countries, we now check our dataset and conduct data analysis.
We have added two columns to create a better understanding of the dataset:
- Gallons GDP Per Capita Can Buy – The number of gallons per person can afford to buy (calculated using GDP Per Capita of their respective countries)
- xTimes Yearly Gallons Per Capita Can Buy – The number of yearly gallons per person can afford to buy.
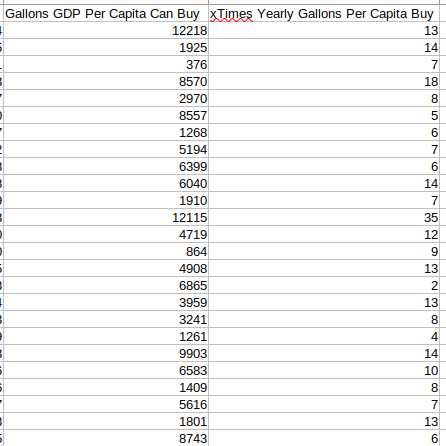
The aforementioned columns give us insight into people’s fuel purchasing power, which illustrates how each country’s economy is impacted by its citizens’ financial situation.
We arranged two columns—Daily Oil Consumption (Barrels) and World Share—in descending order to determine which nation uses the most fuel globally. As the world’s economic hub and true superpower, the United States consumes the most fuel, as does China which is second on the list, another superpower on the rise.
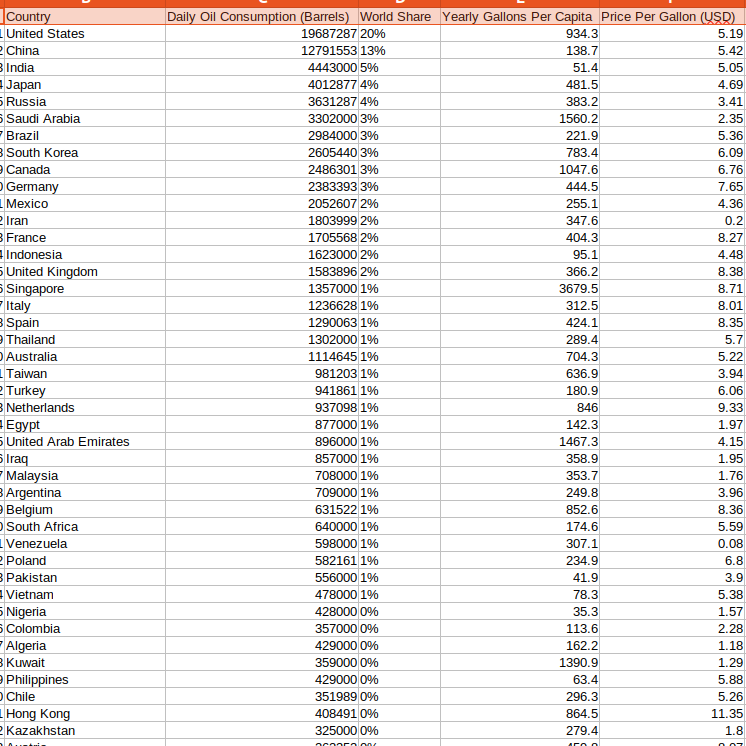
We need to know which country currently has the highest fuel prices after looking at the dataset and the dramatically rising cost of fuel. According to the updated prices as of June 20, 2022, we discovered that North Korea has the shockingly high fuel price per gallon at 14.5 dollars. Because of the US imposing sanctions on North Korea for purchasing items for its nuclear missile programmes, there are political tensions between North Korea and the US.
Conclusion
We can infer that as long as Russia’s invasion of Ukraine persists, fuel prices will probably rise, even in the near term. On the other hand, Russia will be able to start exporting its oil and meet the world’s fuel demand if this invasion is intervened in and stopped in the near future or the situation is most likely to worsen.
All of this data analysis was done using GridDB because it facilitated quick access to and effective reading, writing, and storing of data.