Project Overview
Introduction
This project will showcase how to create an interactive data science dashboard using GridDB and Streamlit.
Using past projects’ data ingested into GridDB, we will be using Streamlit to visualize New York City Crime Complaints. Streamlit makes it quick and easy to develop any kind of dashboard with a variety of widgets that can be used for input and output. In this project, we use the input widgets to build a GridDB TQL query string and a chart output widget to show the returned data.
Requirements
For this project, we will need to install Streamlit and have GridDB installed along with its Python Client
You will also of course need to have the NYC data inserted into your DB. You can read about this with tons more detail in our previous blog: Geospatial Analysis of NYC Crime Data with GridDB
Setup
Install GridDB
To install GridDB, please take a look at the documentation
Install Streamlit
Installing Streamlit is done via pip
pip3 install streamlit --user
Note: If encountering issues installing with pip, please make sure that your pip is at the latest version.
Ingest
To start, we will load all of the data (in CSV form) into our GridDB server. Though we could easily load the data directly from CSV into dataframes objects, loading them into our database first will significantly increase the speed of the application because of GridDB’s hybrid in-memory architecture. Not only that, but our queries are also boosted by only loading the relevant data into our dataframes (as opposed to loading all 7m rows).
So, to ingest the NYC data into your DB, you can use the following script. The data is pulled from NYC Open Data.
To ingest, we simply use the CSVParser Library:
 Iterable records = CSVFormat.RFC4180.withFirstRecordAsHeader().parse(in);
   for (CSVRecord record : records) {
        Complaint c = parseCsvRecord(record);
        if(c != null)
            col.put(c);
   }
   col.commit();
More detailed instructions found in our previous blog post here
The basic gist of it is: you download the source code from here and then point your CLASSPATH to both the griddb.jar and the CSV parse jar. From there you compile the Ingest.java and run the Java files with the data named as rows.csv in the same directory. The program will then run and ingest the data into your GridDB server.
If you are following along with this project and are a tad impatient, you do not need to wait for the entire 7 million rows to be ingested into your DB. For testing purposes, you can simply ingest ~50k rows or so.
Now that we have some working data in the GridDB server and Streamlit is installed, we can get started with the meat of this project.
Source Code
Connecting To GridDB Server
First, we will we need to connect our Python code to our GridDB server. The following snippet shows libraries used and also the connection details.
#!/usr/bin/python3
import pandas as pd
import streamlit as st
import griddb_python
import datetime
import traceback

griddb = griddb_python
factory = griddb.StoreFactory.get_instance()

gridstore = factory.get_store(
    host="239.0.0.1",
    port=31999,
    cluster_name="defaultCluster",
    username="admin",
    password="admin"
)
You can see we stick with using GridDB’s default connection strings. We are also using pandas which is a great data science tool. You can read about using GridDB with Pandas here: Using Pandas Dataframes with GridDB
Handling Multiple Containers
Next, let’s query the relevant data — as the data set is stored in multiple containers, the app needs to be able to query one, several, or all containers. To start with, all containers access is required for and are opened and stored in a dictionary. We also create an ‘all’ mapping in the dictionary which contains a list of every container we opened so we can query all precincts.
cols = {}
for x in range(1, 125):
    col = gridstore.get_container("precinct_"+str(x))
    if col != None:
        cols[x] = [col]

cols['all'] = (e[0] for e in cols.values())
Finally, we iterate through the precincts that were selected with the streamlit widget. Usually there will only be one precinct, but in the case of ‘all’, every precinct will be queried. For simplicity’s sake, we are not using Multiquery.
df=pd.DataFrame()
for col in cols[precinct]:
    try:
        q = col.query(tql)
        rs = q.fetch(False)
        df = df.append(rs.fetch_rows())
    except:
        pass
Input Widgets
Streamlit has a variety of input widgets that can be added to your dashboard, the comprehensive list can be found in their API Reference.
Calendar
The streamlit date_input widget allows the user to select a start and end date. The dates are returned as a tuple of datetime.date objects which must be first converted to datetime.datetime objects using datetime.datetime.combine().
date_range = st.date_input("Period", [datetime.date(2010, 1,1), datetime.date(2020, 12, 31) ])
start = datetime.datetime.combine(date_range[0], datetime.datetime.min.time())
end = datetime.datetime.combine(date_range[1], datetime.datetime.min.time())
Then the datetime.datetime objects can be converted to millisecond epochs with int(datetime.datetime.timestamp()*1000) and used within the TQL query.
tql = "select * where CMPLNT_FR > TO_TIMESTAMP_MS("+str(int(start.timestamp()*1000))+") AND CMPLNT_FR < TO_TIMESTAMP_MS("+str(int(end.timestamp()*1000))+")"Sliders, Radio Buttons, Select Boxes
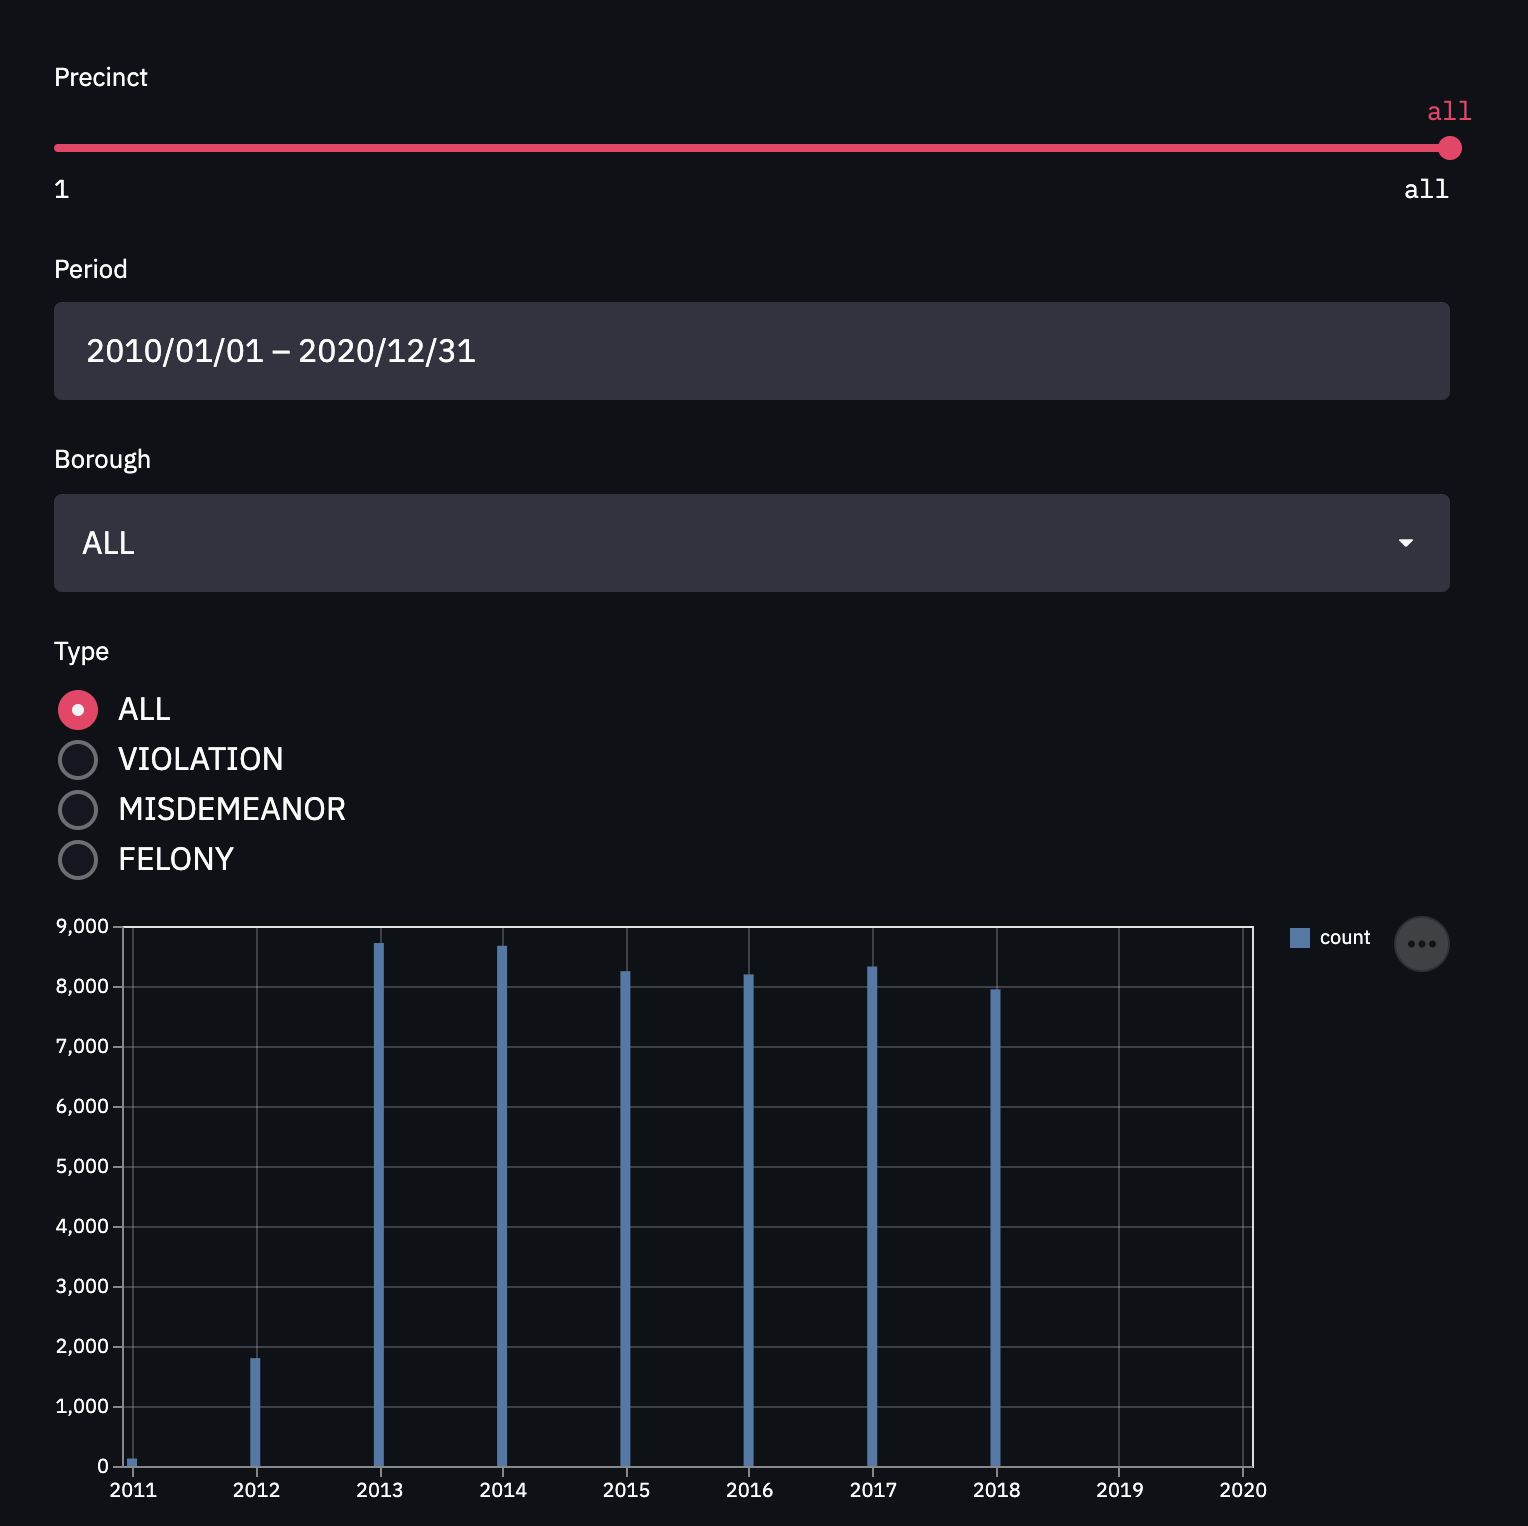
Streamlit’s other input widgets are fairly simple, each taking a list potential inputs and returning the selected item.
precinct = st.select_slider("Precinct", list(cols.keys()), value='all' )
br_name = st.selectbox("Borough", ["ALL", "MANHATTAN", "QUEENS", "BRONX" , "BROOKLYN", "STATEN ISLAND" ])
ctype = st.radio("Type", ["ALL", "VIOLATION", "MISDEMEANOR" , "FELONY" ])
Their output can then be used in the TQL statement.
if br_name != "ALL":
    tql = tql + " AND BORO_NM = '"+br_name+"'"

if ctype != "ALL":
    tql = tql + " AND LAW_CAT_CD = '"+ctype+"'"
Output Widgets
There are several different output widgets including the bar chart, text, and a map, we’ll use in this project.
Titles & Text
Before we display all of our beautiful data, we can also choose to display a nice title and some helper text to really tie the entire dashboard together. For example, we can use st.title to include a title for the dashboard. We can also choose to include some text as well with st.write.
So, before all of our input widgets, let’s add a title:
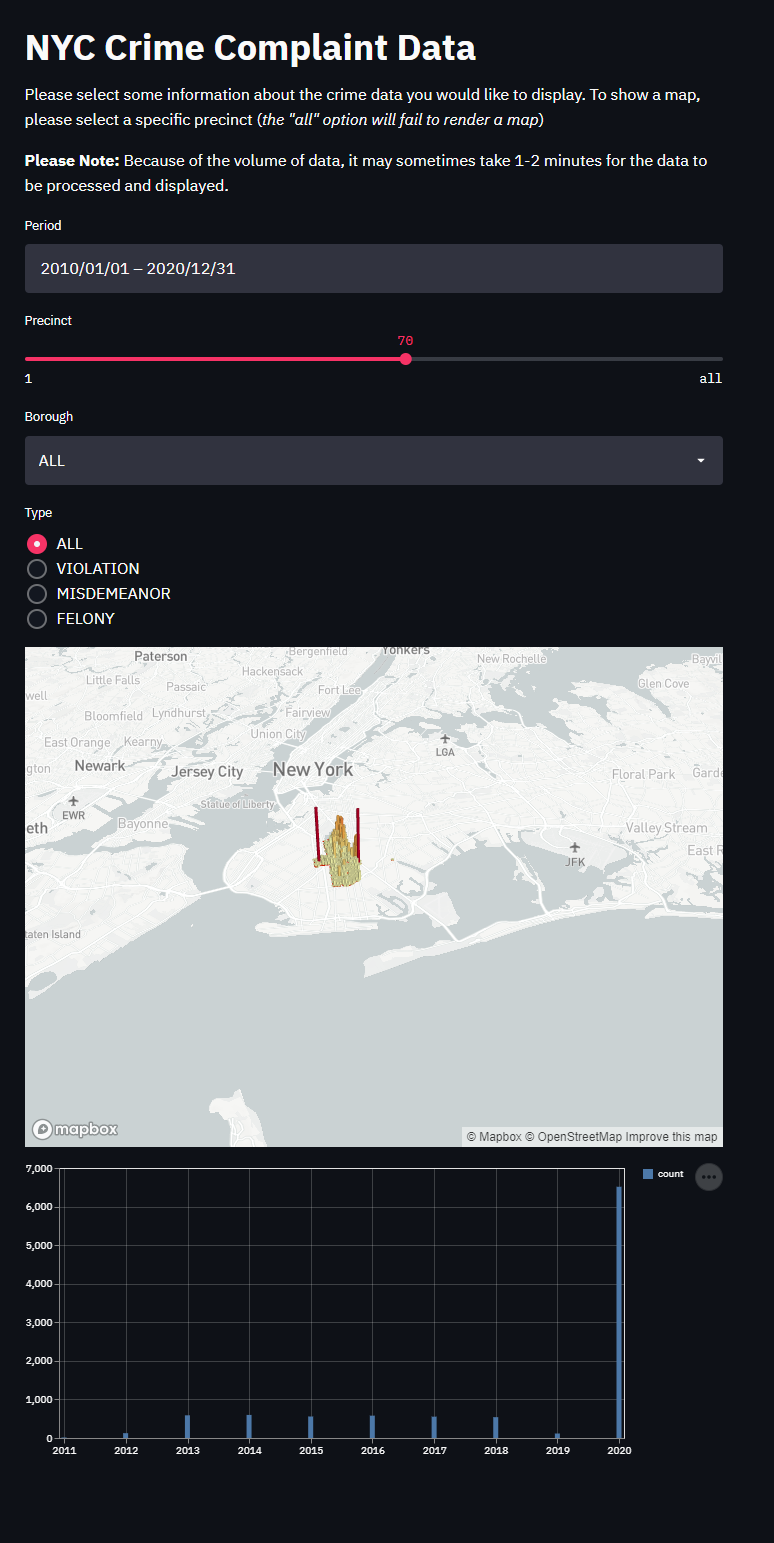
st.title('NYC Crime Complaint Data')
And then a brief description of the purpose of this application:
st.write('Please select some information about the crime data you would like to display. Once complete, a bar graph will be shown at the bottom')
Map
To show a map of the data, we will use the pydeck widget.
if precinct != "all":
df = df.rename(columns={'Latitude': 'lat', 'Longitude': 'lon'})
st.pydeck_chart(pdk.Deck(
map_style='mapbox://styles/mapbox/light-v9',
initial_view_state=pdk.ViewState(
latitude=40.76,
longitude=-73.93,
zoom=10,
pitch=50,
),
layers=[
pdk.Layer(
'HexagonLayer',
data=df,
get_position='[lon, lat]',
radius=100,
get_elevation=500,
elevation_scale=4,
elevation_range=[0, 1000],
pickable=True,
extruded=True,
),
pdk.Layer(
'ScatterplotLayer',
data=df,
get_position='[lon, lat]',
get_color='[200, 30, 0, 160]',
get_radius=100,
),
],
))
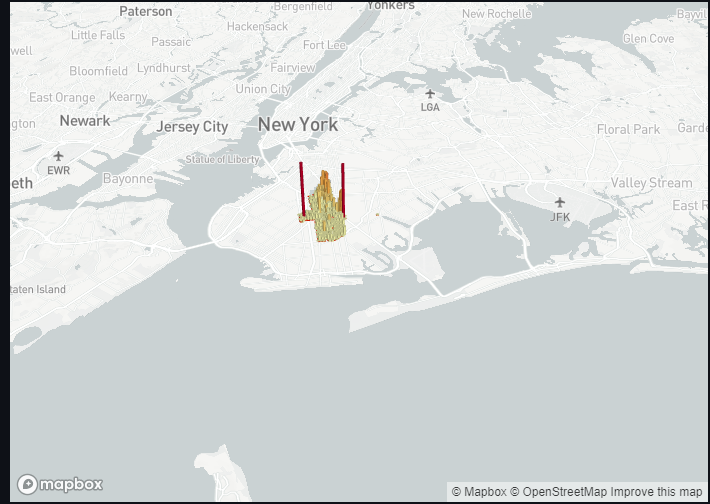
else:
print("Can only draw maps for single precincts")To start, we need to restrict the data which is to be rendered to solely on a dataset smaller than “all precincts”. We found that trying to draw all data points easily overwhelms the entire script. From there, it’s as simple as inputting the dataframes we already had set up and various other options.
So now when you select a specific precinct, a nice map should be rendered:
Bar Chart
To effectively display the number of crime complaints over a bucket_size of time, we need to bucket the data. Before we do that, we will need to first determine the number of buckets to use which depends on the time bucket_size. If the time bucket_size is just a few weeks, it doesn’t make sense sense to use month long buckets and vice-versa; using daily or weekly buckets would also not visualize the data well if the time bucket_size is several years.
bucket_size='Y'
if delta.days < 800:
    bucket_size = 'M'
elif delta.days < 90:
    bucket_size = 'D'
Now we can convert the CMPLNT_FR column to Pandas Datetime and put the data into buckets/groups.
df['CMPLNT_FR'] = pd.to_datetime(df['CMPLNT_FR'])
df = df.groupby([pd.Grouper(key='CMPLNT_FR',freq=bucket_size)]).size().reset_index(name='count')
Displaying the chart is a simple one liner:
st.bar_chart(data=df)Running Project
Now that you’ve got everything set up, simply run the program
streamlit run app.py
and follow the External URL provided to view your beautiful data science dashboard in your browser.
Conclusion
When you consider the quality of dashboard being produced and the amount of code required, Streamlit has proven that it can make it incredibly quick and easy to develop data-driven dashboards. Combined with GridDB’s high performance and scalability, it allows developers to visualize and gain insight into their dataset without significant investment or time. The complete source code used in this projects can be found in GridDB.net’s GitHub account here.
Here is a final screenshot of the entire dashboard