
Collecting and analyzing data is an integral part of any data-driven organization or software application. One of the most cumbersome tasks when it comes to collecting data is populating the Database. This article focuses on providing a simple method to convert raw data and populate the Database using them in a structured manner.
Prerequisites
In this tutorial, you will be using Python as the programming language to create the script while using GridDB as the backend database.
Before continuing, you need to have a GridDB database up and running. We have provided comprehensive documentation on how to install GridDB via the source code or as a package
To create the connection between Python and GridDB, you will be using the GridDB Python Connector. The final outcome should be a data set that you can obtain using Kaggle. You will be using the Formula 1 World Championship (1950 – 2020) dataset in CSV format for the purpose of this tutorial.
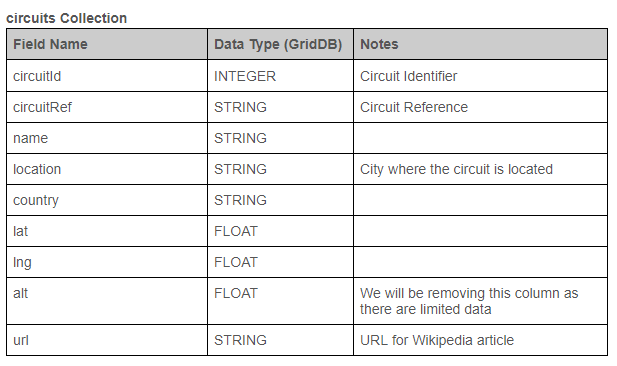
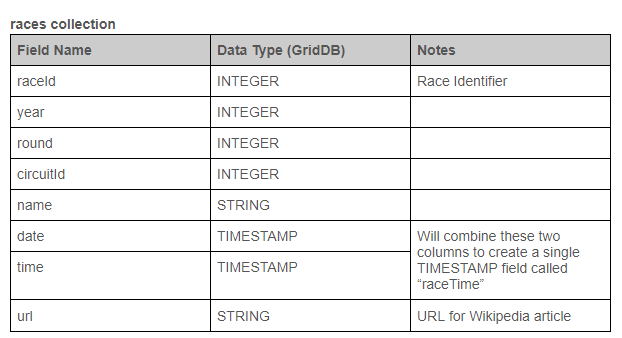
That dataset contains multiple CSV files, and you will be using circuits.csv and races.csv files there for the examples in this article. The following tables display the basic structure of each table and the changes planned for transforming the data. The Data Type refers to the target data type in GridDB.
Extracting Data
When it comes to extracting data from a CSV file, the main steps would be to read the CSV file, identify the data structure and finally iterate each row of data. This is the universal process for any data extraction from a CSV file.
One method to achieve this would be to open the CSV file, then read it as a CSV using the “csv.reader†function and identify the column names and data separately.
import csv

        with open("./dataset/circuits.csv") as csv_file:
            csv_reader = csv.reader(csv_file, delimiter=',')
            line_count = 0
            for row in csv_reader:
                if line_count == 0:
                    print(f'Column Names : {", ".join(row)}')
                    line_count += 1
                else:
                    print(f'{", ".join(row)}')
The above code block will read the circuits.csv file and identify the column names and data to be extracted from each row. However, this method limits what you can do with the extracted data. For a complex data analysis, you need a structured data set that can be manipulated.
Python has a powerful and unique library called Pandas, specifically designed to create data structures and analyze complex data. Therefore, when migrating data, the best option will be to create a Pandas data frame from the extracted data. It will enable us to transform the data according to our requirements easily.
Pandas library contains all the functions you need to extract data from a CSV file. The read_csv function in Pandas will read a designated CSV file and automatically identify the column names and data. You can illustrate this functionality of Pandas as shown below.
import pandas as pd

        # Create a data frame from circuits.csv
        circuits_data = pd.read_csv("./dataset/circuits.csv")
        # Create a data frame from races.csv
        races_data = pd.read_csv("./dataset/races.csv")

        # Print all rows in circuits.csv
        for row in circuits_data.itertuples(index=False):
            print(f"{row}")

        # Print all rows in races.csv
        for row in races_data.itertuples(index=False):
            print(f"{row}")
The above code will create two data frames as one for each CSV file, which then iterates the data frame to identify the structured data set extracted from the CSV files. The index option is set to False as there is already an index used within the data sets (circuitId and raceId). Data frames are the gateway for managing and transforming your data.
The next step would be to clean and transform the extracted data. It can be easily done using the functions provided by the Pandas data frame. So, let’s clean and transform the CSV files to provide a structured data set to the Database.
import pandas as pd
# Create data frames while defining null values
circuits_data = pd.read_csv("./dataset/circuits.csv", na_values=['\N'])
races_data = pd.read_csv("./dataset/races.csv", na_values=['\N'])
# View the structure of the data frames
circuits_data.info()
races_data.info()
# Drop the alt column
circuits_data.drop(['alt'], inplace=True, axis=1)
# Create a combined raceTime column
races_data['time'].replace({pd.NaT: "00:00:00"}, inplace=True)
races_data['raceTime'] = races_data['date'] + " " + races_data['time']
races_data['raceTime'] = pd.to_datetime(races_data['raceTime'], infer_datetime_format=True)
# Drop the data and time columns
races_data.drop(['date', 'time'], inplace=True, axis=1)
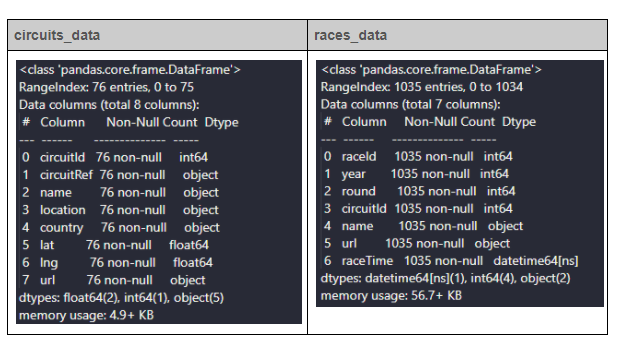
# View the structure of modified data frames
circuits_data.info()
races_data.info()
In the above code block, you have changed the way of reading the CSV files using the na_values option. You can identify null values defined as (N) in the CSV file and convert them to actual pandas null values (NaT).
Then, using the info() method, you can identify the structure of the data frame.
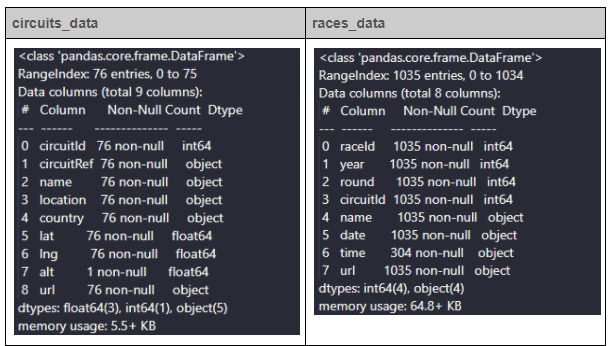
Since there is only one record (Non-Null Count) for the alt column in the circuits_data, you can drop it from the data set. Then, in the races_data, first, replace the null values in the time column. Then, combine data and time columns to a new column called raceTime and convert it to a datetime field. Finally, drop the redundant data and time columns from the data frame.
You can view the modified data frames by using the info() method again.
The next step would be to insert the data into the Database.
Interacting with the Database
The usual way for interacting with the Database would be to create a container in GridDB and insert data to it using either put or multi_put methods. However, The GridDB python client also supports inserting data using data frames.
The first step in the container method is to create the containers to store data. In this instance, you will create two GridDB containers called circuits and races. When creating the containers, the most important thing is to define the correct data types, as incorrect data types can cause errors when performing database operations.
   circuits_container = "circuits"
        races_container = "races"

        # Create Collection circuits
        circuits_containerInfo = griddb.ContainerInfo(circuits_container,
                        [["circuitId", griddb.Type.INTEGER],
                        ["circuitRef", griddb.Type.STRING],
                        ["name", griddb.Type.STRING],
                        ["location", griddb.Type.STRING],
                        ["country", griddb.Type.STRING],
                        ["lat", griddb.Type.FLOAT],
                        ["lng", griddb.Type.FLOAT],
                        ["url", griddb.Type.STRING]],
                        griddb.ContainerType.COLLECTION, True)
        circuits_columns = gridstore.put_container(circuits_containerInfo)

        # Create Collection races
        races_containerInfo = griddb.ContainerInfo(races_container,
                        [["raceID", griddb.Type.INTEGER],
                        ["year", griddb.Type.INTEGER],
                        ["round", griddb.Type.INTEGER],
                        ["circuitId", griddb.Type.INTEGER],
                        ["name", griddb.Type.STRING],
                        ["url", griddb.Type.STRING],
                        ["raceTime", griddb.Type.TIMESTAMP]],
                        griddb.ContainerType.COLLECTION, True)
        races_columns = gridstore.put_container(races_containerInfo)
The next step is to insert the rows into the Database. Using the put_rows function, you can define data frames as the input. This will insert each row in the data frame into the GridDB collection.
    # Put rows
        # Define the data frames
        circuits_columns.put_rows(circuits_data)
        races_columns.put_rows(races_data)
That’s it, and you have successfully transformed and cleaned the data retrieved via the CSV file and added the required data to the GridDB collections in a structured format.
Retrieving Data from the Database
In this section, let’s see how to retrieve data from the Database. GridDB provides the query functionality which enables users to query the containers to retrieve data from the Database. Have a look at the following code block. There, we have retrieved containers using the get_container function and then querying the collection to extract the required data.
    # Define the container names
            circuits_container = "circuits"
            races_container = "races"

            # Get the containers
            circuits_data = gridstore.get_container(circuits_container)
            races_data = gridstore.get_container(races_container)

            # Fetch all rows - circuits_container
            query = circuits_data.query("select *")
            rs = query.fetch(False)
            print(f"{circuits_container} Data")

            # Iterate and create a list
            retrieved_data= []
            while rs.has_next():
                data = rs.next()
                retrieved_data.append(data)

            print(retrieved_data)

            # Convert the list to a pandas data frame
            circuits_dataframe = pd.DataFrame(retrieved_data, columns=['circuitId', 'circuitRef', 'name', 'location', 'country', 'lat', 'lng', 'url'])

            # Get the data frame details
            print(circuits_dataframe )
            circuits_dataframe.info()

            # Fetch all rows - races_container
            query = races_data.query("select * where raceTime >= TIMESTAMP('2010-12-31T00:00:00.000Z')")
            rs = query.fetch()
            print(f"{races_container} Data")

            # Iterate and create a list
            retrieved_data= []
            while rs.has_next():
                data = rs.next()
                retrieved_data.append(data)

            print(retrieved_data)

            # Convert the list to a pandas data frame
            races_dataframe = pd.DataFrame(retrieved_data, columns=['raceID', 'year', 'round', 'circuitId', 'name', 'url', 'raceTime'])

            # Get the data frame details
            print(races_dataframe )
            races_dataframe.info()
In the above code, you are querying for all the records in the “circuits” collection and selecting races that happened on or after 2010-12-31 using TQL, which is the GridDB query language.
You can use a basic TQL select statement for the circuits container to select all the records as below.
circuits_data.query("select *")
For the races container, you have to filter data to retrieve the races that only happened on or after 2010-12-31.
races_data.query("select * where raceTime >= TIMESTAMP('2010-12-31T00:00:00.000Z')")
If needed, you can filter data further using conditions, ordering, limits and offsets in TQL according to your requirements. Following are some example queries that can be performed using TQL.
# TQL Example Queries
        query = races_data.query("select * where circuitID = 22 raceTime >= TIMESTAMP('2010-12-31T10:10:00.000Z')")
        query = races_data.query("select * where raceTime >= TIMESTAMP('2010-12-31T10:10:00.000Z') order by asc")
        query = races_data.query("select * limit 25")
Next, you have to fetch the resulting output and then iterate the output to create a list containing all the fetched records. Finally, convert the lists into two Pandas data frames called circuits_dataframe and races_dataframe.
When converting the lists to data frames, you can define the columns option to map the data with the relevant fields. Now you have two new data frames populated by the data in the GridDB database.
Organizing Data
Now you have two data sets, and what can you do with them? The answer is anything. You can use that data to fulfill any user requirement. Consider the simple example of having to create a single combined data set using both data frames.
For that, you can use the merge function in the Pandas library to combine the two data frames to a single data frame using the circuitID as the relationship between the two data sets. Before merging, you need to change the column name as there is a name and URL column in both data frames. Let’s rename each data frame to represent their individual data set and merge the data into a single data frame called results.
# Rename columns in circuits_dataframe
        circuits_dataframe.rename(
            columns={
                'name' : 'circuit_name',
                'url' : 'circuit_info'
            }, inplace=True
        )

        # Rename columns in races_dataframe
        races_dataframe.rename(
            columns={
                'name' : 'race_name',
                'url' : 'race_info'
            }, inplace=True
        )

        # Merge the two data sets
        result = pd.merge(races_dataframe, circuits_dataframe, on='circuitId')

        # Print the result
        print(result)
It’s that simple. Now you have successfully created a single data set that can be used to analyze the data more effectively.
Conclusion
In this article, you learned how to transform and clean data retrieved by a CSV file. Additionally, you could also learn how to interact with GridDB to create collections using the transformed data and how to query them to extract the required information. You can use this article as a base for starting your data journey into the data analytics world.