
With the release of a completely free GridDB Cloud, we wanted to pair its free service with Grafana Cloud, another free Cloud-based service which can get you up and running in seconds. For this article, we will walk through the steps of how to display time-series data from your GridDB Cloud shared instance to Grafana Cloud.
If you are unfamiliar with GridDB Cloud, you can read our quick start guide here: GridDB Cloud Quick Start Guide — that article will teach you how to sign up, how to begin using GridDB Cloud and more of the basics: who, what, when, where, why. If you are also unfamiliar with Grafana, you can read about its capabilities and strength from their docs: https://grafana.com/docs/grafana/latest/introduction/.
If you are curious as to how Grafana can enhance your GridDB experience, I will point you to a previous article we have written here: Creating Heatmaps of Geometry Data using Grafana & GridDB. Essentially, Grafana’s advanced visualization tools allow for some creative ways of analyzing and peering into your data.
This article’s goal is simple: showcase how to use the cloud offerings from both vendors to display some GridDB Data in Grafana Cloud. We will go through this process step-by-step and explain any idiosyncrasies along the way. Let’s get started!
Implementation
First, here’s a link to the Grafana dashboard that we will be using for this article: https://imru.grafana.net/public-dashboards/8a9f9f8ed9d34582aecca867a50c9613. Source code can be found here:
$ git clone https://github.com/griddbnet/Blogs.git --branch 4_grafana_cloud
Prereqs
To follow along, you will need to have access to a free account of both GridDB Cloud and Grafana Cloud.
Technical Overview
To query our GridDB Cloud data from Grafana, we will be sending HTTP Requests directly from Grafana to our GridDB Cloud. And indeed, any sort of interactions we want to make with our free GridDB Cloud instance will be done via Web API interface; this topic is covered in the quick start linked above, as well as in this article: GridDB WebAPI. You can also of course check out the official docs: GridDB_Web_API_Reference.
The specifics of how to form our query and how to create our allowlist to get around GridDB’s firewall will be the subject of our next few sections.
Adding Grafana’s IP Addresses to GridDB’s Allowlist
In order for our Grafana Cloud instance to send HTTP Requests which are accepted as “safe” by our GridDB Cloud, we need to be able to add all potential IP Addresses to our GridDB Cloud instance. Browsing through the Grafana documentation, we see that they have these lists readily available for these exact scenarios: https://grafana.com/docs/grafana-cloud/account-management/allow-list/. The list we need is called ‘Hosted Grafana’, and if you take a quick peek, you’ll see the list is easily over 100 lines, so then how do we efficiently add all of these to our GridDB Cloud management portal?
Well, luckily we have already encountered this scenario in our previous article: Create a Serverless IoT Hub using GridDB Cloud and Microsoft Azure. To solve the issue, we wrote a simple bash script which will take the .txt file as the input and add each ip address to the allowlist of GridDB Cloud’s online portal. Source code and instructions found in that blog in the “#whitelist” section. Here’s the script:
#!/bin/bash

file=$1

#EXAMPLE
#runCurl() {
#curl 'https://cloud57.griddb.com/mfcloud57/dbaas/web-api/contracts/m01wc1a/access-list' -X POST -H 'User-Agent: Mozilla/5.0 (Macintosh; Intel Mac OS X 10.15; rv:133.0) Gecko/20100101 Firefox/133.0' -H 'Accept: application/json, text/plain, */*' -H 'Accept-Language: en-US,en;q=0.5' -H 'Accept-Encoding: gzip, deflate, br, zstd' -H 'Content-Type: application/json;charset=utf-8' -H 'Access-Control-Allow-Origin: *' -H 'Authorization: Bearer eyJ0eXAiOiJBY2Nlc3MiLCJIUzI1NiJ9.eyJzdWIiOiJkMTg4NjlhZC1mYjUxLTQwMWMtOWQ0Yy03YzI3MGNkZTBmZDkiLCJleHAiOjE3MzEwMTEyMTMsInJvbGUiOiJBZG1pbiIsInN5c3RlbVR5cGUiOjF9.B1MsV9-Nu8m8mJbsp6dKABjJDBjQDdc9aRLffTlTcVM' -H 'Origin: https://cloud5197.griddb.com' -H 'Connection: keep-alive' -H 'Referer: https://cloud5197.griddb.com/mfcloud5197/portal/' -H 'Sec-Fetch-Dest: empty' -H 'Sec-Fetch-Mode: cors' -H 'Sec-Fetch-Site: same-origin' -H 'Priority: u=0' -H 'Pragma: no-cache' -H 'Cache-Control: no-cache' --data-raw $1
#}

runCurl() {
    <paste VALUE HERE> $1
}

while IFS= read -r line; do
    for ip in ${line//,/ }; do
        echo "Whitelisting IP Address: $ip"
        runCurl $ip
    done
done < "$file"</paste>
Querying GridDB Cloud from Grafana Cloud
Out of the box, Grafana does have a method of sending HTTP Requests to your services, but from what I could tell, they’re geared towards specific services (ie. Prometheus) and are limited to HTTP GET Requests. In our case, all of our requests to GridDB Cloud require POST requests, so we needed to find a solution for this: enter the Infinity plugin.
Once installed, we will be able to add it as a datasource.
Using Infinity as a Data Source
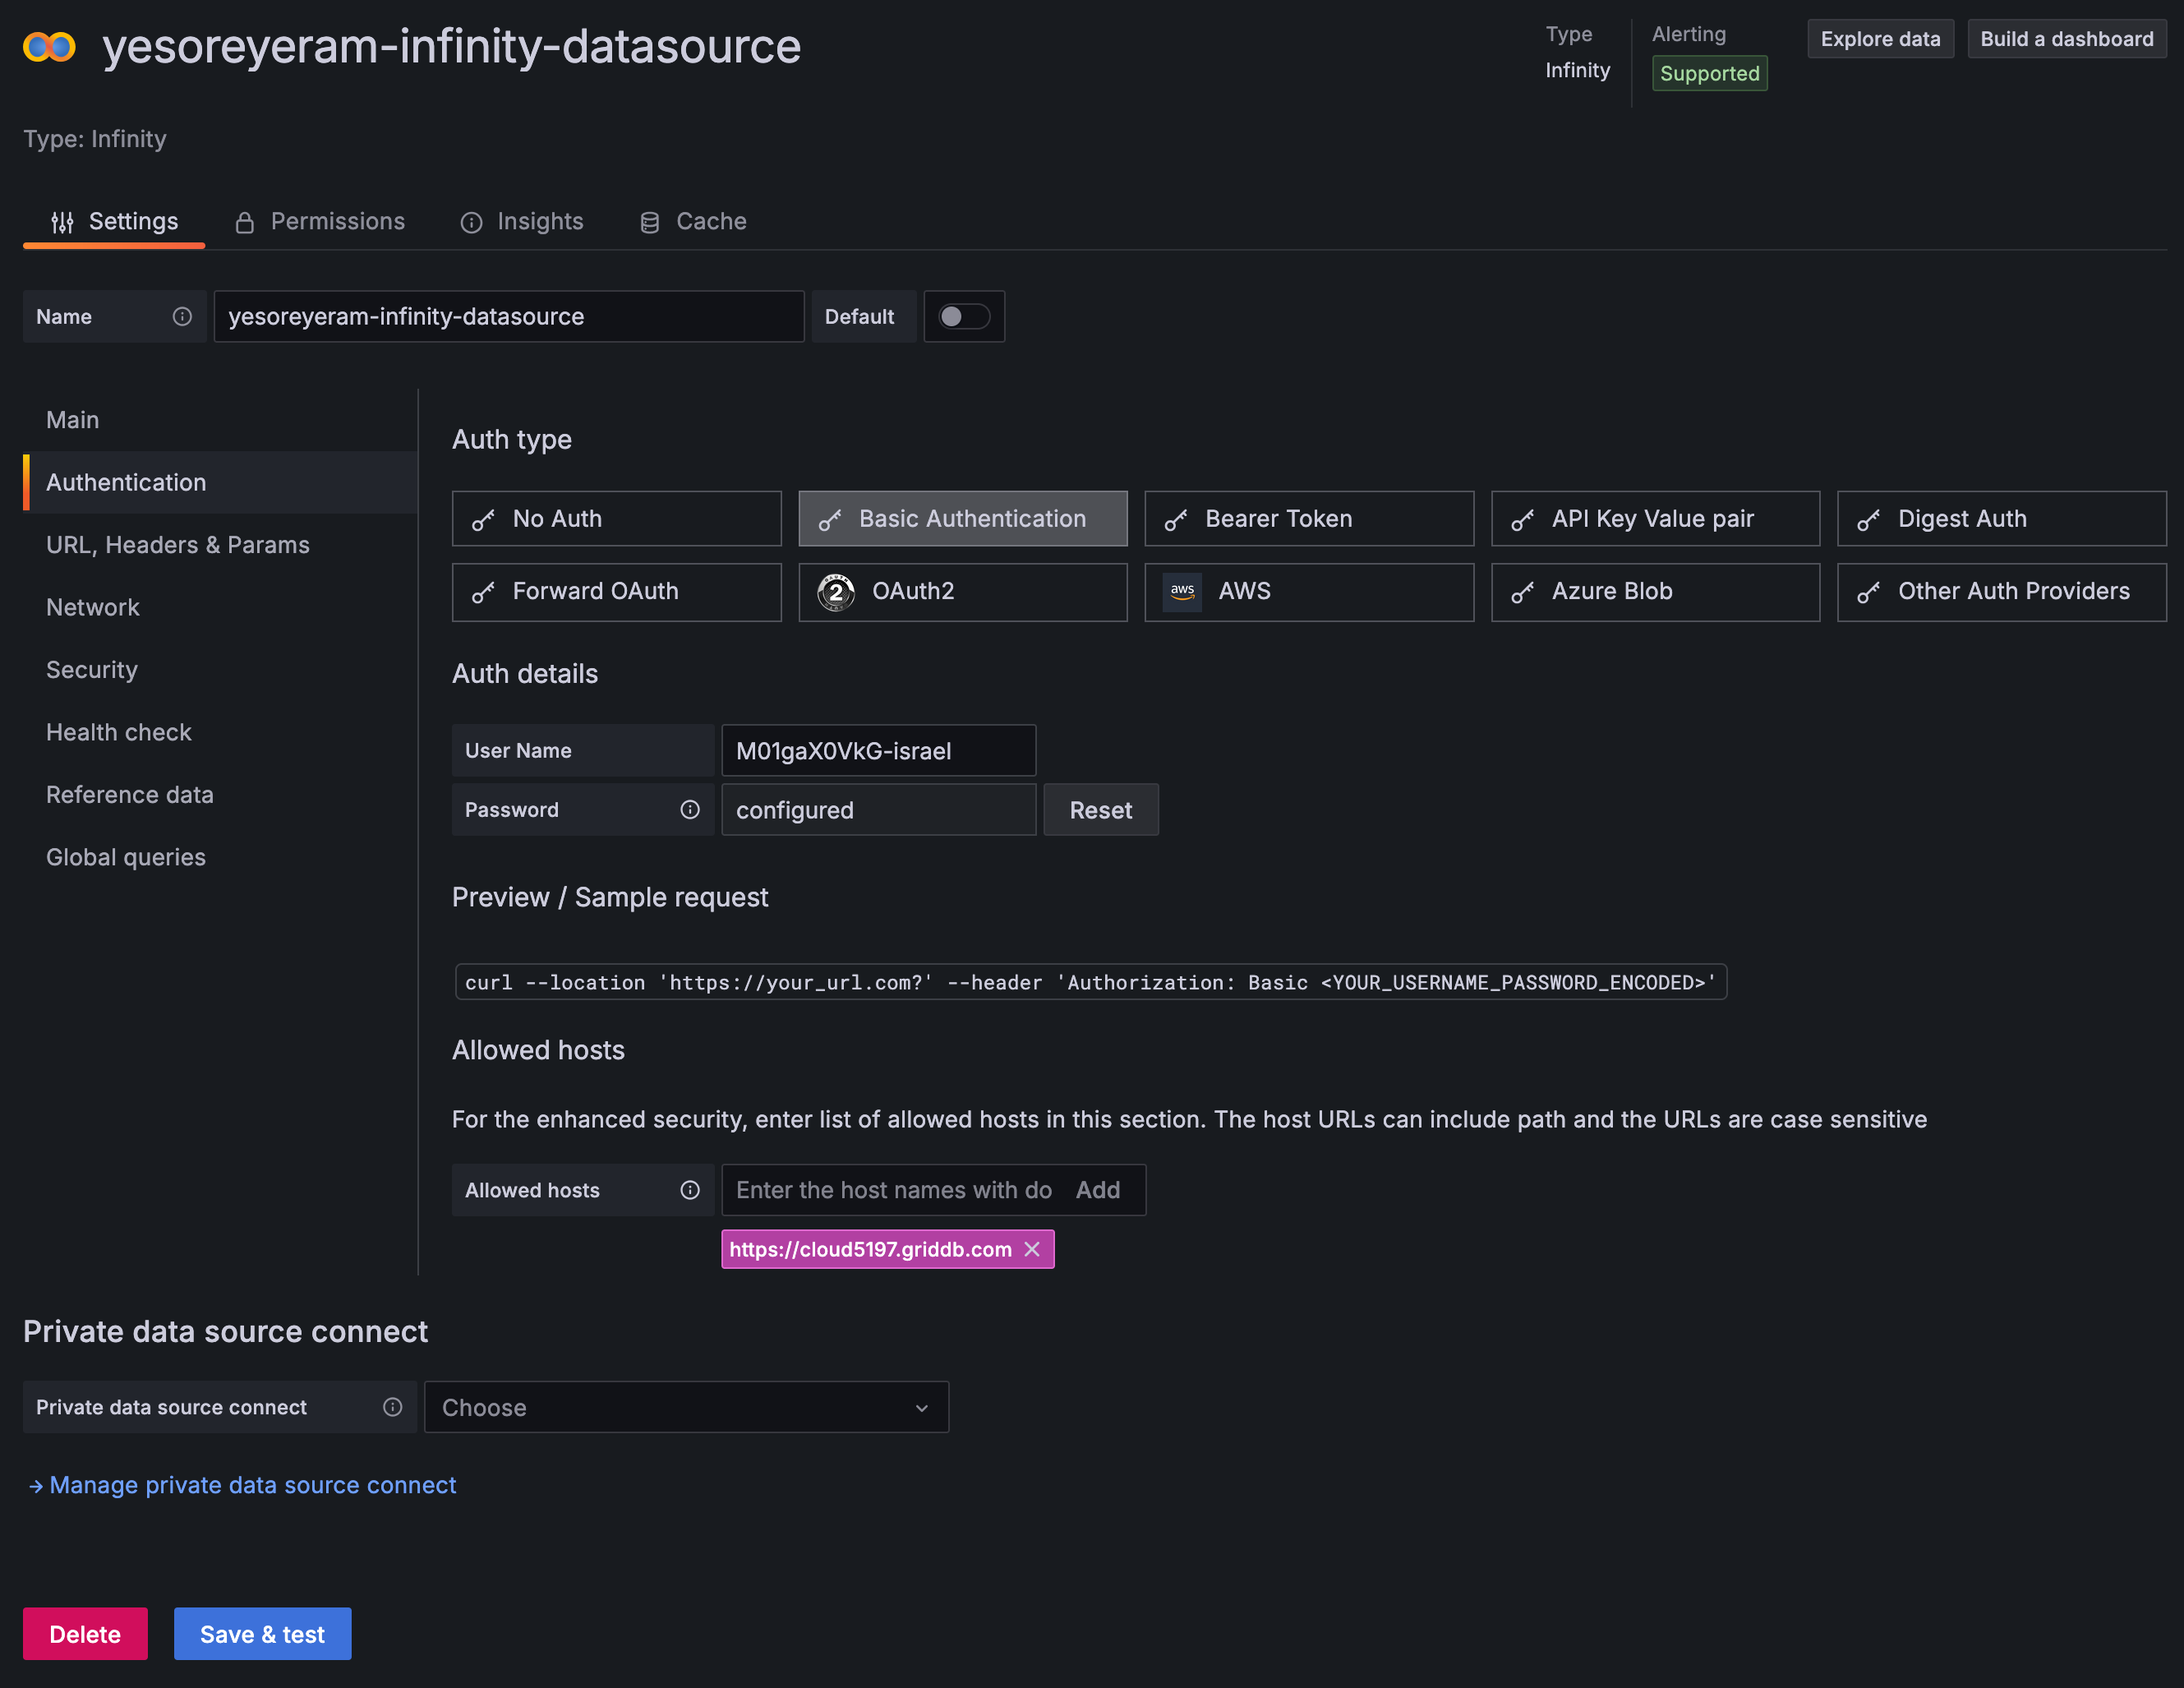
From within your Grafana Cloud instance, select Connections –> Data Sources. If you installed the Infinity data source properly, it should show up in this section as an option — please select it. From here, we can add all of our pertinent GridDB Cloud information to forge our connection — we will need to add our basic authentication, and allow our portal’s hostname in the allowed hosts list.
Once added, lastly click on the health check section and add your Web API + “/checkConnection” (ie. https://cloud5197.griddb.com:443/griddb/v2/gs_clustermfcloud5197/dbs/ZV8YUlQ8/checkConnection) as a simple sanity check AND health check. Hit Save & Test.
We should be able to query our GridDB Cloud Database now!
Ingesting Usable Time Series Data
Before we query our data, let’s first ensure that we have working data in our GridDB Cloud. If you are following along and have just now made a new account, you can follow our quick start guide to ingest an IoT sample data that can be found on Kaggle. Here is a direct link to the section in the guide: https://griddb.net/en/blog/griddb-cloud-quick-start-guide/#ingest. Here, we are ingesting a csv file and calling the container device1.
Forming Our HTTP Requests
Now that we can communicate between services, let’s get the data we want. From the Grafana Cloud menu, select Dashboards and then select “new” in the top right corner and then finally Add visualization.
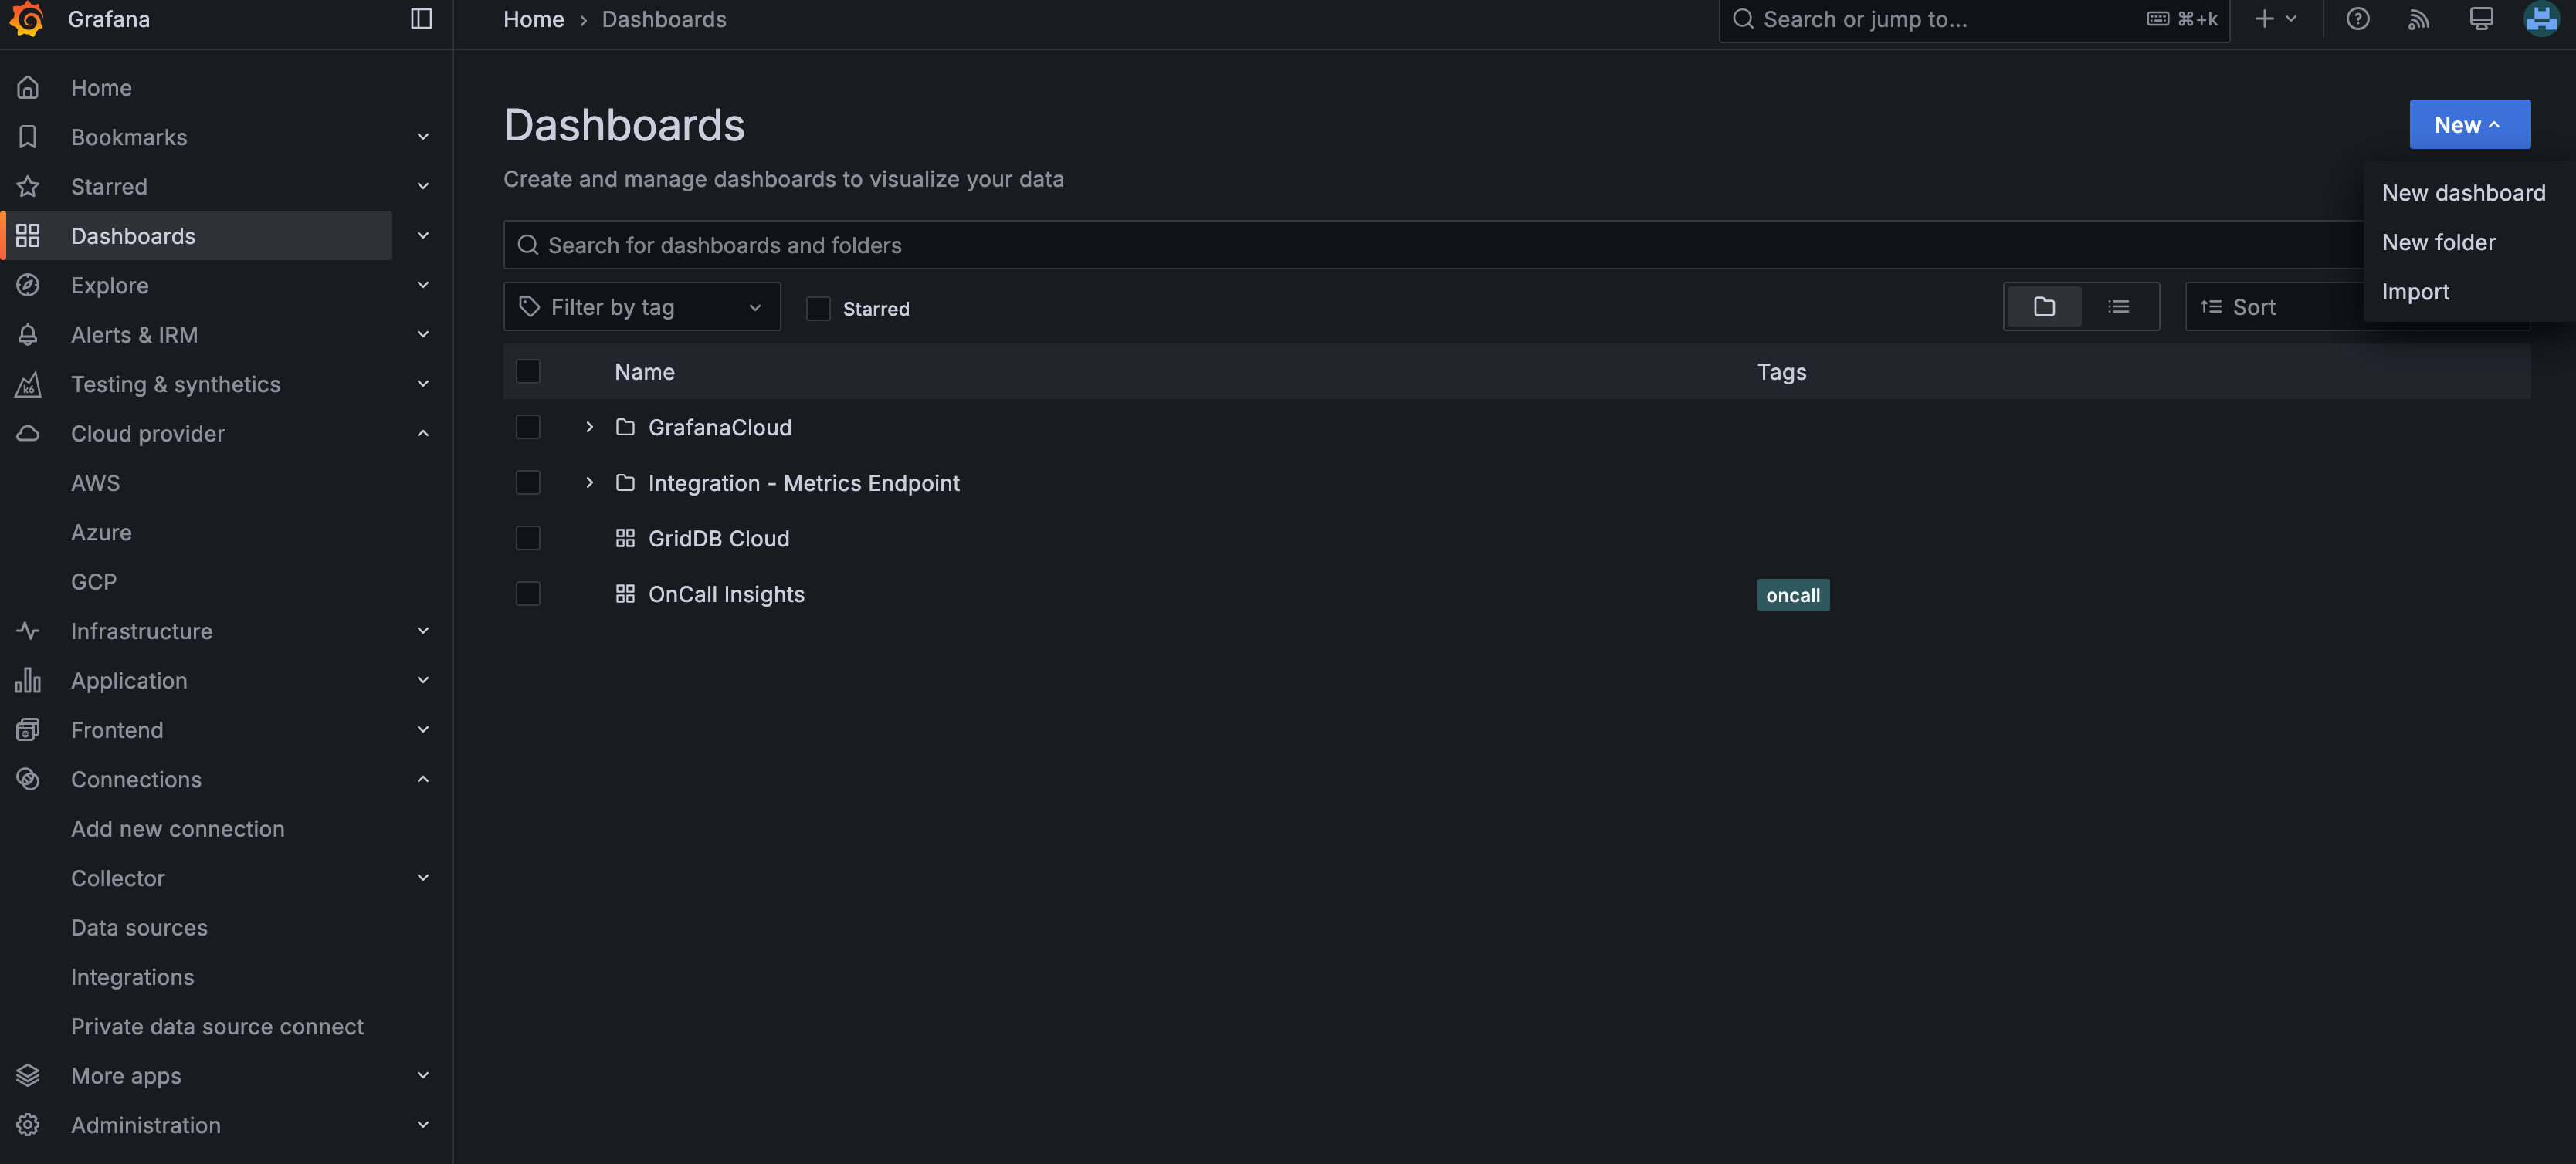
From here, select Infinity and you will now have a blank graph and a place to put your query.
![]()
And now for some options:
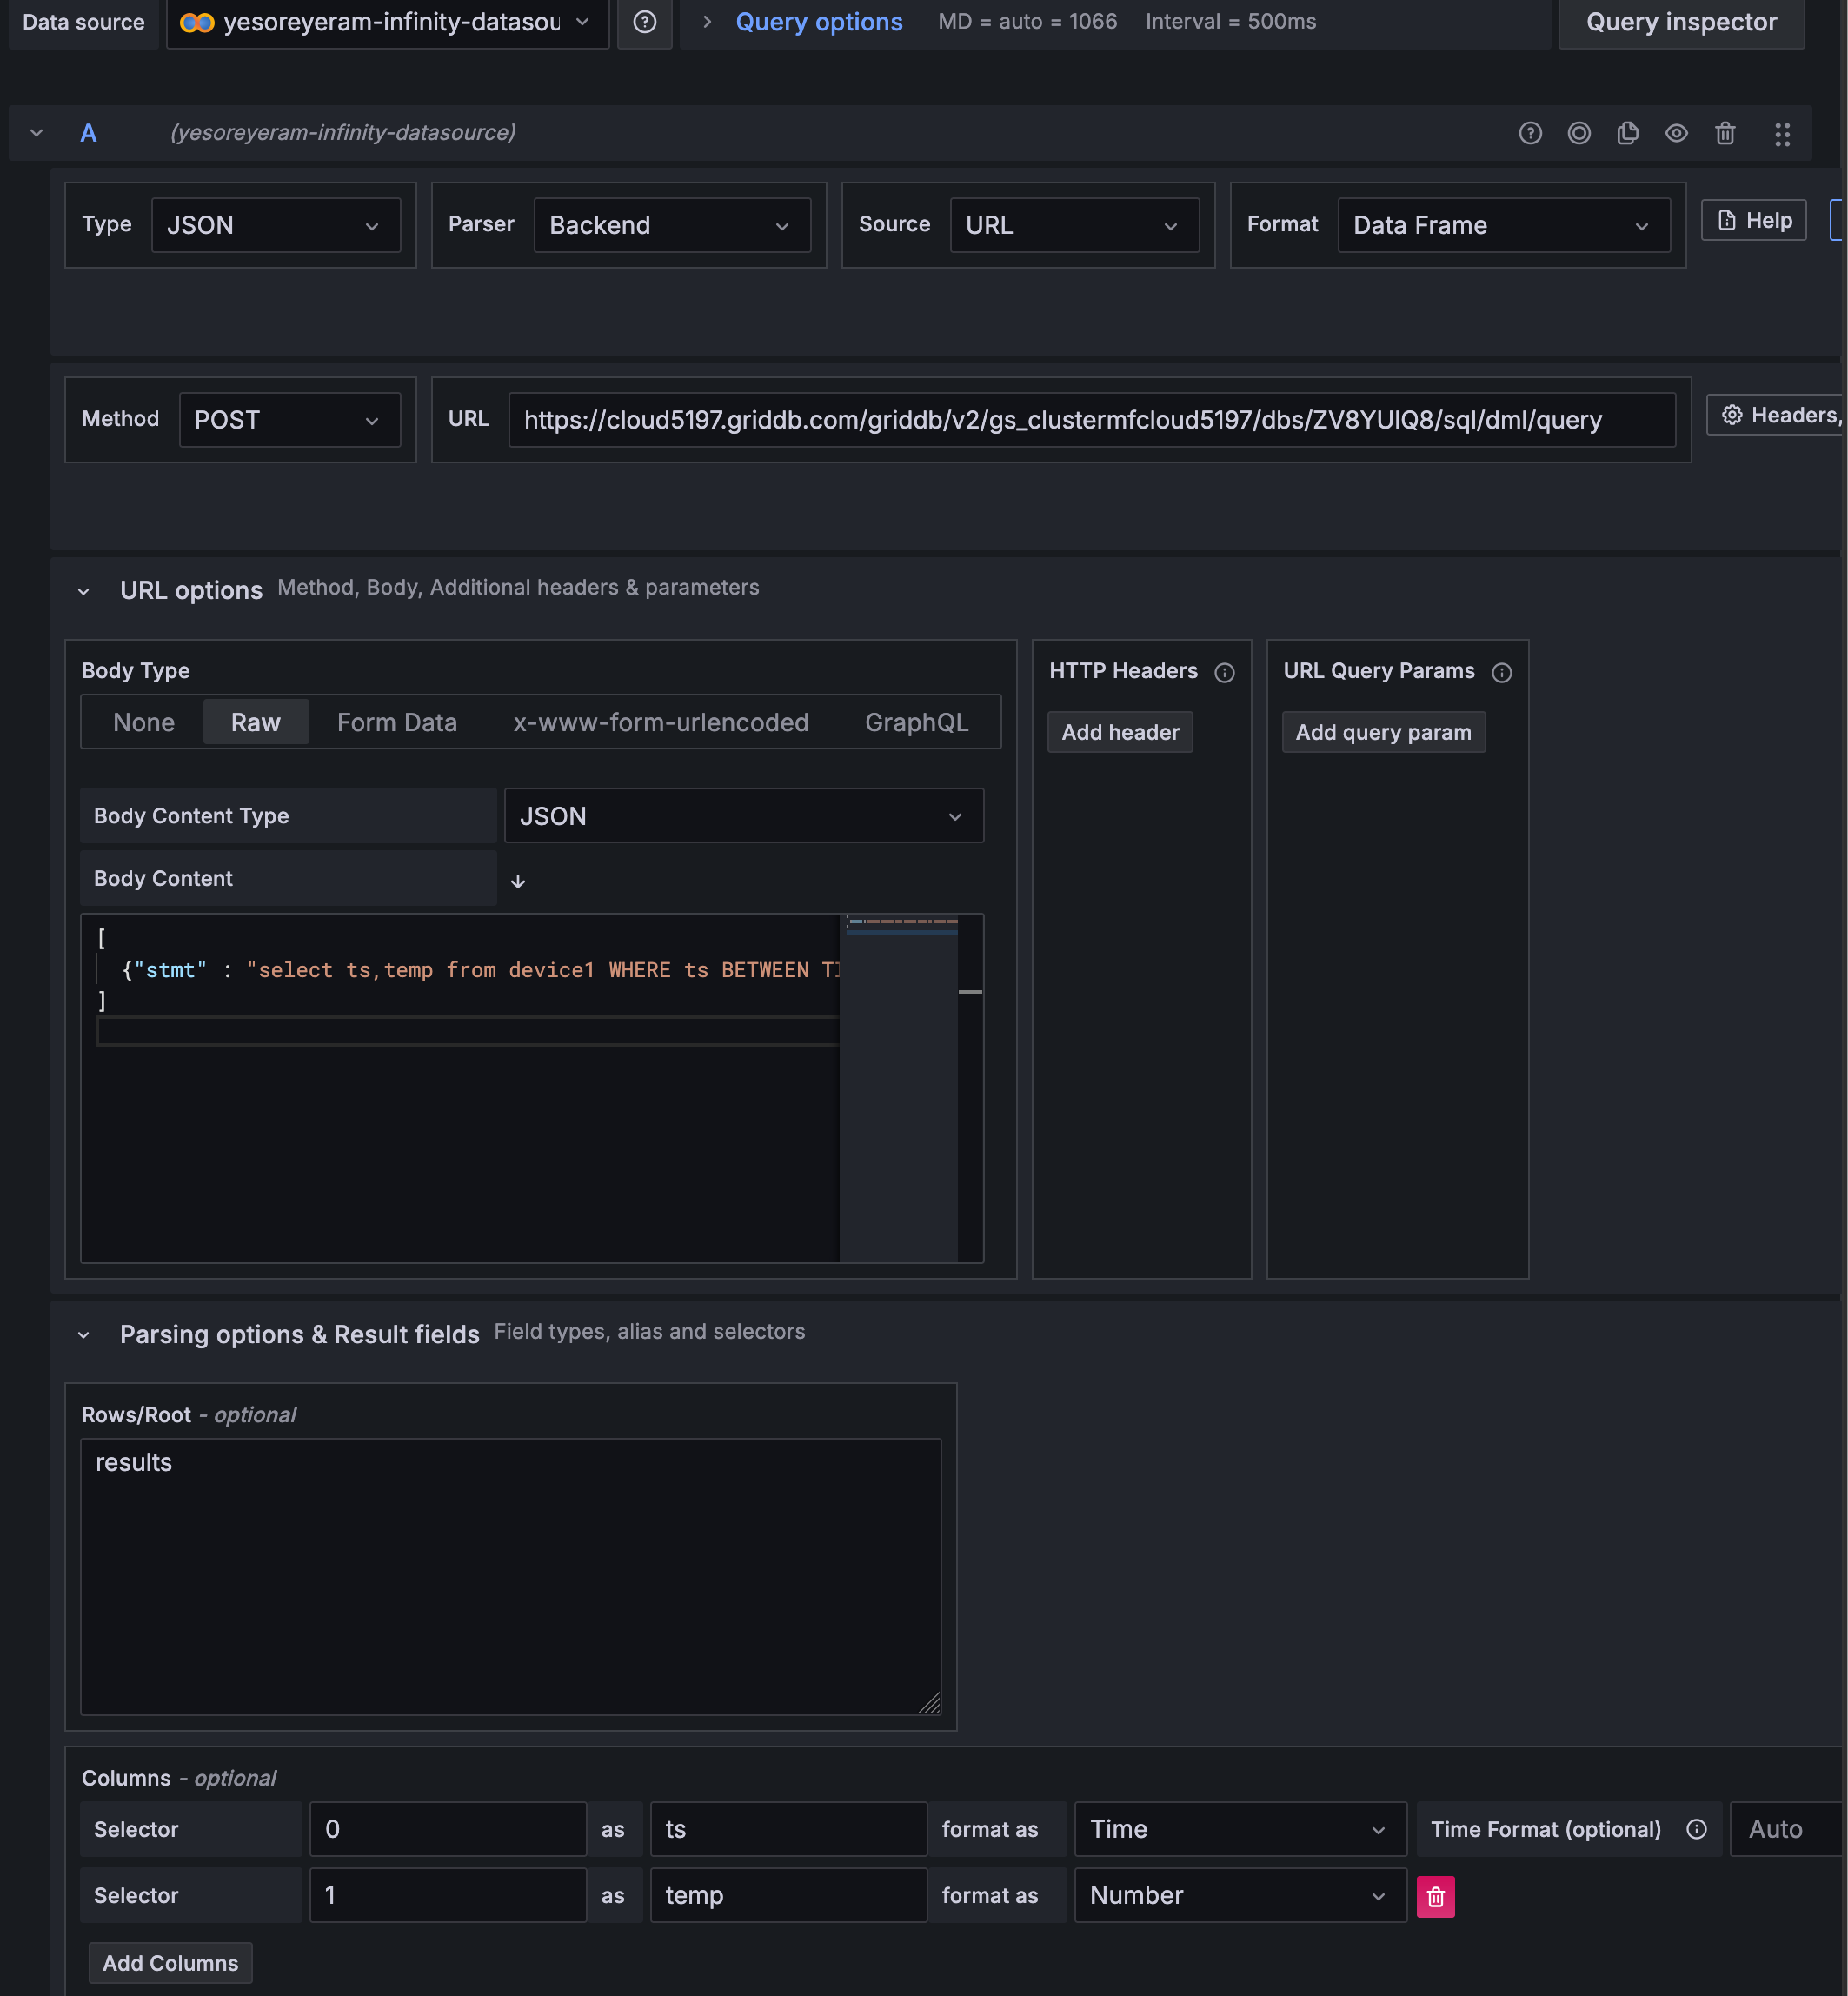
Type: JSON
Parser: Backend
Source: URL
Format: Data Frame
Method: POST
Note: Here is a screenshot of the entire query we will form in the ensuing lines of text (screenshot will be displayed again at the end once you can better understand what all of the words mean)
The parser and format being what they are allows for us to properly name and label the data being received from GridDB Cloud because of the unusual way in which responds to the requestor with data. Instead of sending back the rows of data in JSON format (which, to be fair, if you’ve got a thousand rows, it’s a lot of unnecessary bloat), GridDB Cloud sends back the information as a JSON file, but the actual rows of data are in array form, with the schema being listed under another JSON key name (columns).
As for the URL, you can take a look at the links above about how to form your Web API Request, but here are two we will be using:
- SQL:
https://cloud5197.griddb.com/griddb/v2/gs_clustermfcloud5197/dbs/ZV8YUlQ8/sql/dml/query - API:
https://cloud5197.griddb.com:443/griddb/v2/gs_clustermfcloud5197/dbs/ZV8YUlQ8/containers/device1/rows
In each case, we will have different selectors for our returned data, as well as different body payloads that we will be sending off as a request. First, let’s take a look at the SQL Query.
Making a Simple SQL-Select Query
First, set your URL to match the query above. The format is as follows: https://[cloud-portal-name].griddb.com/griddb/[clustername]/dbs/[database-name]/sql/dml/query. And then we form our SQL Query within the body of the request.
To properly parse this, we set the format as data frame, and then under parsing options & Results fields, we type in “results” in the JSONata/rows selector box and then click add columns. To start, we simply want a couple of columns from our dataset, so we can se the columns like so:
Selector: 0 #array index
as: ts
format-as: Time
And then we select the column we want to track in our graph, let’s take a look at temperature
Selector: 7
as: temperature
format-as: Number
Lastly, because it’s a POST request, we must send off something within the body of our request, but in this case, it’s going to be a SQL query. Right under the Method dropdown menu, there’s a button that says Headers, Body, Request Params. Click this.
Fro that sub menu, set the Body Type to Raw and set the Body Content Type to JSON. And in the large text box you can add your actual body — or in our case, our SQL query:
[
  {"stmt" : "select * from device1 LIMIT 1000"}
]
Note: I highly recommend using a limit on your query, otherwise Grafana may malfunction trying to show all of your data points.
In the graph above, click “zoom in on data” if necessary and your data will be displayed! Cool!
More SQL Queries (Group By Range, Aggregations)
With the advent of GridDB 5.7, you can make some more complex SQL Queries as well and are not limited to SELECT statements. For example, we can use the SQL Group By Range which allows for us to perform a aggregation operations over a given time span. For example, this is what our query looks like: select ts,temp from device1 WHERE ts BETWEEN TIMESTAMP('2020-07-12T01:00:25.984Z') AND TIMESTAMP('2020-07-12T01:22:29.050Z') GROUP BY RANGE (ts) EVERY (1, SECOND) FILL (LINEAR). So we can simply plug this in to our Infinity plugin and see the results (Hint: you may need to change your column selectors and refresh the graph).
You can also do other SQL aggregation queries, really there is no limit; you can read more about that in the GridDB SQL docs: https://griddb.org/docs-en/manuals/GridDB_SQL_Reference.html
Using the Group By Range feature is excellent for creating dense graphs even if you don’t have a dense enough dataset!
API Query
We can also skip SQL and just the API to make queries using simple JSON options in our body request. The URL will be built out as follows: https://[cloud-portal-name].griddb.com/griddb/[clustername]/dbs/[database-name]/containers/[container-name]/rows
So enter in your URL and, set the Body Content Type to JSON, and the Body content to some combination of the following:
{
  "offset" : 0,
  "limit"  : 100,
  "condition" : "temp >= 30",
  "sort" : "temp desc"
}
As you can see, you set the condition and sort options for your dataset. The column options remain the same, except the results of the data is now called ‘rows’, so change that option in the Parsing Options & Result Fields section; you can keep the same column selectors as those stay the same.
Conclusion
Once you are done querying and adding in the data you like, you can of course save your dashboard for future use. And that’s all! If you have followed along, you have now been able to pair GridDB Cloud with Grafana Cloud to display your data.
If you have any questions about the blog, please create a Stack Overflow post here https://stackoverflow.com/questions/ask?tags=griddb .
Make sure that you use the “griddb” tag so our engineers can quickly reply to your questions.