Introduction
We have previously used the Open Data New York City Crimes to do a geospatial analysis of NYC’s crime complaint data. In that blog, we used the very helpful lat/lon data to try to make some predictions and analysis.
For this blog, we will use the same dataset to draw a heatmap of the crime complaints using GridDB and Grafana. When completed, we hope to have a nice graphic of an explicit heatmap overlaid on top of a map of NYC, showing the various complaints with an indication of frequency.
Ingesting Data
This dataset provided by Open Data is rather robust, but we have included the code to Ingest all of it in our previous blog. What follows is a quick version of that.
All complaint data will be placed into one container for simplicity sake. We have a simple .java program which handles the ingest for us. To use it, you need to first add the commons-csv and gridstore jars into your CLASSPATH. From there, simply compile and run the Ingest file. You will also need to name the .csv file to rows.csv (or jump into the Ingest file and change the filename)
Here’s a summary:
$ export CLASSPATH=:/path/to/commons-csv-1.8.jar:/usr/share/java/gridstore.jar
$ javac Ingest.java
$ java Ingest
Using the GridDB WebAPI
To use our GridDB data with Grafana, we will elect to use the GridDB WebAPI. With this, we can send data to our Grafana instance using the HTTP protocol. To get the WebAPI running, you can follow the instructions from our previous blog; you can also of course check out the official Github page.
And as a side note, using the WebAPI is not limited to using in conjunction with Grafana — we can also use it for ingesting and querying data as seen in this blog.
Installing And Using Grafana
Grafana is a product that “allows you to query, visualize, alert on and understand your metrics no matter where they are stored.” In our usecase, we will hope to use Grafana to visualize our geometry lat/lon data from the NYCC dataset in the form of a heatmap.
To install Grafana, you can read our previous blog here. Here is a shortened version:
To install Grafana itself:
sudo cat > /etc/yum.repos.d/grafana.repo << EOF
> [grafana]
> name=grafana
> baseurl=https://packages.grafana.com/oss/rpm
> repo_gpgcheck=1
> enabled=1
> gpgcheck=1
> gpgkey=https://packages.grafana.com/gpg.key
> sslverify=1
> sslcacert=/etc/pki/tls/certs/ca-bundle.crt
> EOF
and then
sudo yum -y install grafanaAnd then to start it:
sudo /bin/systemctl enable grafana-server.service
sudo /bin/systemctl start grafana-server.service
Please just make sure that the Grafana version you are installing is version 8.1 or newer.
Next we will be installing the GridDB plugin. As mentioned, it’s in the blog, but you can get a quick rundown here:
$ curl -o https://github.com/griddb/griddb-datasource/archive/refs/tags/1.1.0.tar.gz
$ tar zxvf 1.1.0.tar.gz
$ cd 1.1.0/
$ sudo cp -a dist /var/lib/grafana/plugins/GridDB-DataSource
Once that is done, we will need to edit the grafana.ini. Nothing fancy, we just need to allow Grafana to run unsigned modules. So open up the file and add this:
[plugins]
allow_loading_unsigned_plugins = griddb-datasource
With our Grafana instance allowing GridDB as a data source, we need to log in to our running Grafana and “Add Datasource”. You can see some examples in this blog as well. Essentially, we point our Grafana Data source to our GridDB WebAPI URL, along with our server’s credentials.
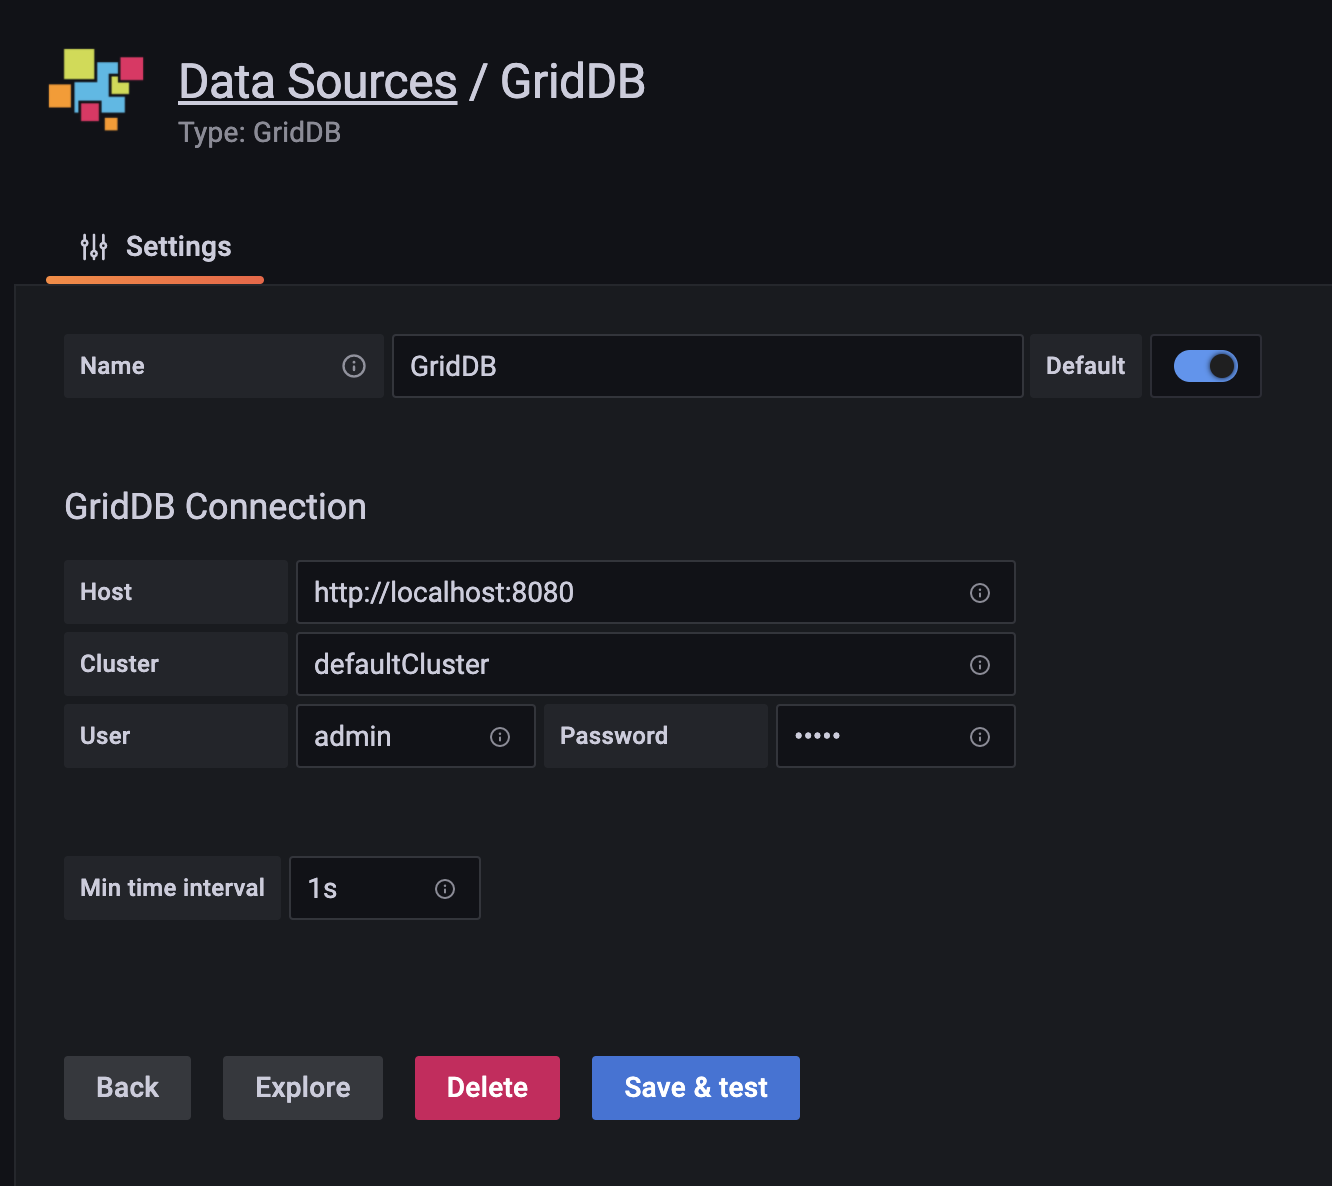
With the information in, simply click save & test. Now we can move on to the fun parts!
Data Visualization
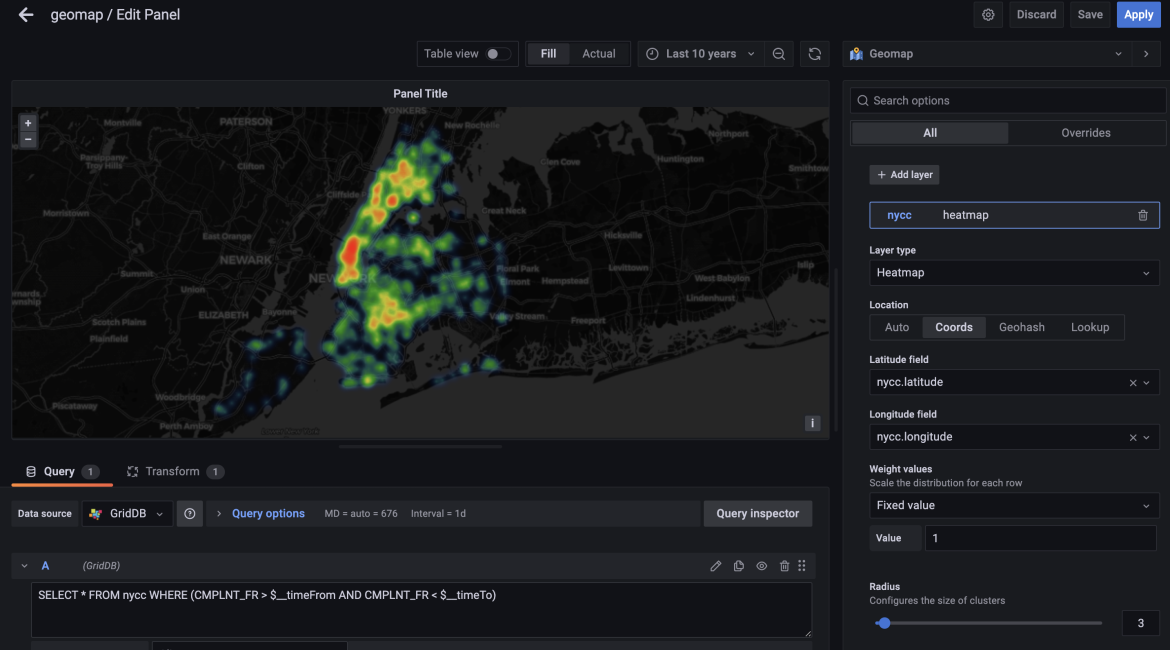
To begin, first create a new panel and then change the visualization type to GeoMAP using the options in the top right corner. Next, set the time period to correspond with the time period in which the complaint data correlates.
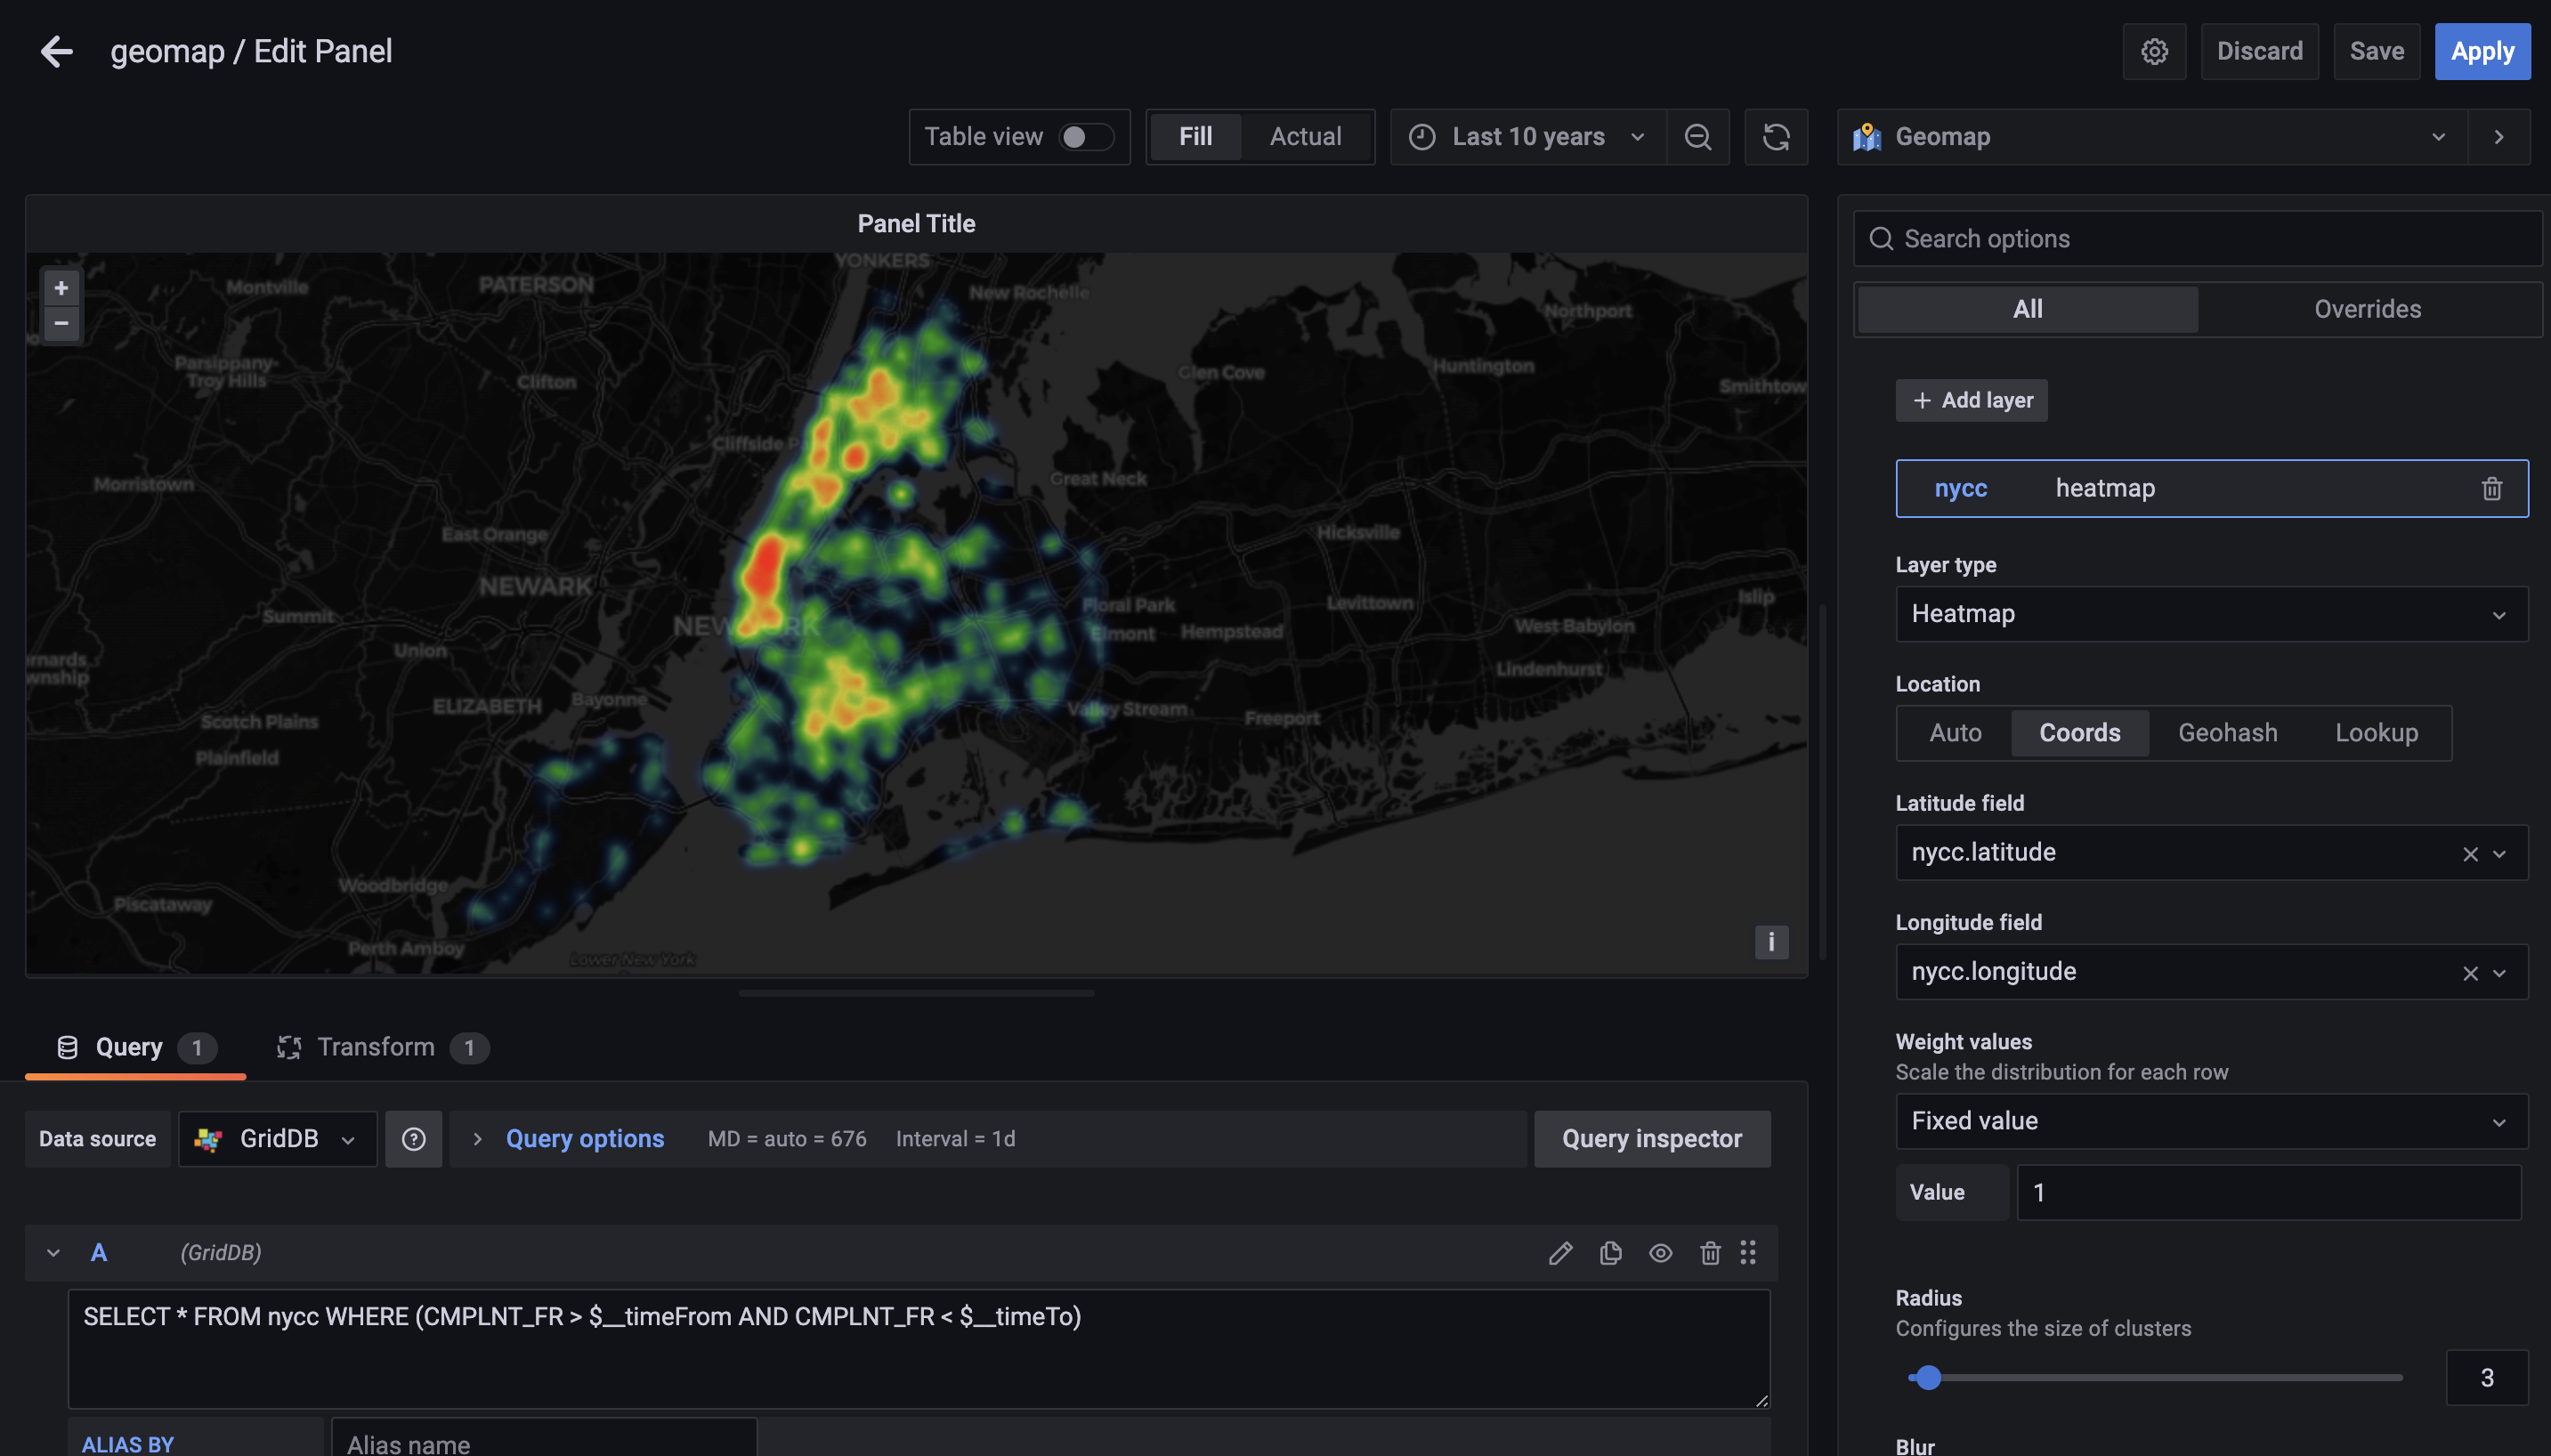
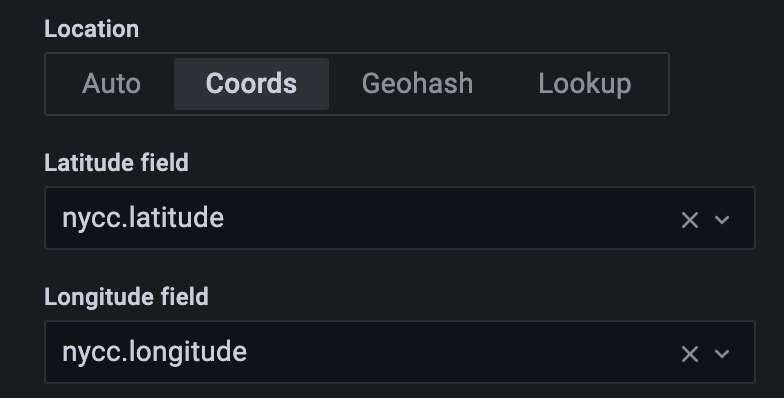
After that, we need to tell our Grafana instance that we would like to use coordinates as our data type. So change the option from Auto to Coords. You will then specify the actual name nycc.latitude and nycc.longitude
The last step will be to use the transformation tab. The dataframes will need to be concatenated together because the GridDB DataSource was developed for an older version of Grafana which uses a different internal data structure.
![]()
Conclusion
Marrying GridDB with Grafana can lead to very fun, helpful, and illuminating results. Large datasets can be visualized in all sorts of matter of ways with Grafana; and even more importantly, using GridDB allows for large datasets to be easily shared with any Grafana instance.
The heatmap generated by this dataset really helps to think about and analyze the same dataset in a brand new way.