Introduction
As global populations grow, agriculture faces mounting pressure to produce more food sustainably. Precision agriculture, powered by IoT and real-time data analytics, offers a solution by optimizing crop management through actionable insights. However, traditional relational databases struggle with the velocity and volume of agricultural time-series data, creating performance bottlenecks when farmers need immediate analysis of crop conditions, weather patterns, and soil metrics.
GridDB’s specialized time-series architecture addresses these challenges through efficient storage, high-speed ingestion, and optimized query performance for temporal data patterns. Its ability to handle mixed-frequency sensor data—from hourly weather readings to daily satellite imagery—makes it particularly well-suited for agricultural monitoring systems.
This article explores a simple Spring Boot application that leverages GridDB Cloud to monitor crop health predicatively. Our implementation integrates real-time weather data from NASA’s POWER API, stores environmental time-series in GridDB, and exposes analytics through REST APIs for dashboard visualization.
Time-Series Database Requirements for Agricultural IoT
An ideal time-series database platform must efficiently ingest, store, and analyze data from diverse sources to enable data-driven decisions in crop health monitoring, irrigation management, and yield prediction. Meeting these demands involves addressing several critical data characteristics and infrastructure requirements, such as:
- High Cardinality
- Numerous unique time series generated by varied sensor types, farm locations, and devices.
- Multi-Frequency Data Streams
- Environmental sensors: Updates every 15 minutes.
- Weather APIs: Typically provide hourly updates.
- Satellite imagery: Collected daily or at intervals of 1 to 7 days.
- Sensor Metrics
- Each sensor point typically captures four distinct metrics (e.g., temperature, humidity, soil moisture, and light intensity).
- Ingestion Volume
- Per farm:
- 100 sensors × 4 metrics × 96 readings/day = ~38,400 records daily.
- Across 500+ farms:
- 500 farms × ~38.4K records = ~19 million inserts per day.
- Per farm:
- Timestamp Precision
- Data is recorded with microsecond-level precision to support fine-grained temporal analysis.
- Query and Storage Requirements
- Optimized for frequent time-based queries (e.g., daily or weekly trends).
- Requires efficient data compression and long-term retention strategies to manage continuous high-volume ingestion.
These patterns demand a robust time-series database like GridDB, designed to handle high-ingest rates, granular timestamps, and complex queries, all essential for scalable agricultural IoT solutions.
Project Overview: Building the Predictive Crop Health Monitoring Farmers
In this project, we focus on real-time crop health monitoring by processing environmental data and displaying important insights through visual dashboards, built with Spring Boot, GridDB Cloud, Thymeleaf, and Chart.js.
System Workflow
- Collection
- Fetches environmental metrics from NASA’s POWER API.
- Storage
- Stores data in GridDB using a time-series model (
CropHealthDatacontainer).
- Stores data in GridDB using a time-series model (
- Analysis
- Processes raw data into actionable stress indicators using
CropHealthService
- Processes raw data into actionable stress indicators using
- Visualization
- Displays daily, weekly, and monthly trends on a web-based dashboard.
Setting Up GridDB Cluster and Spring Boot Integration
Project Structure
Here’s a suggested project structure for this application:
├── pom.xml
├── src
│   ├── main
│   │   ├── java
│   │   │   └── mycode
│   │   │       ├── controller
│   │   │       │   └── CropHealthController.java
│   │   │       ├── dto
│   │   │       │   └── CropHealthData.java
│   │   │       ├── MySpringBootApplication.java
│   │   │       └── service
│   │   │           ├── CollectionService.java
│   │   │           ├── CropHealthService.java
│   │   │           └── RestTemplateConfig.java
│   │   └── resources
│   │       ├── application.properties
│   │       └── templates
│   │           └── dashboard.html
This structure separates controllers, models, repositories, services, and the application entry point into distinct layers, enhancing modularity and maintainability. It can be further customized based on individual requirements.
Set Up GridDB Cloud
For this exercise, we will be using GridDB Cloud vesion. Start by visiting the GridDB Cloud portal and signing up for an account.
![]()
Based on requirements, either the free plan or a paid plan can be selected for broader access. After registration, an email will be sent containing essential details, including the Web API URL and login credentials.
Once the login details are received, log in to the Management GUI to access the cloud instance.
Create Database Credentials
Before interacting with the database, we must create a database user:
- Navigate to Security Settings: In the Management GUI, go to the “GridDB Users” tab.
- Create a Database User: Click “Create Database User,” enter a username and password, and save the credentials. For example, set the username as soccer_admin and a strong password.
- Store Credentials Securely: These will be used in your application to authenticate with GridDB Cloud.
Set Allowed IP Addresses
To restrict access to authorized sources, configure the allowed IP settings:
- Navigate to Security Settings: In the Management GUI, go to the “Network Access” tab and locate the “Allowed IP” section and add the .
- Add IP Addresses: For development, you can temporarily add your local machine’s IP.
Add POM Dependency
Here’s an example of how to configure the dependency in the pom.xml file:
<?xml version="1.0" encoding="UTF-8"?>
<project xmlns="http://maven.apache.org/POM/4.0.0"
  xmlns:xsi="http://www.w3.org/2001/XMLSchema-instance"
  xsi:schemaLocation="http://maven.apache.org/POM/4.0.0 http://maven.apache.org/maven-v4_0_0.xsd">
  <modelVersion>4.0.0</modelVersion>
  <groupId>com.example</groupId>
  <artifactId>my-griddb-app</artifactId>
  <version>1.0-SNAPSHOT</version>
  <name>my-griddb-app</name>
  <description>GridDB Application with Spring Boot</description>
  <url>http://maven.apache.org</url>

  <parent>
    <groupId>org.springframework.boot</groupId>
    <artifactId>spring-boot-starter-parent</artifactId>
    <version>3.2.4</version>
    <relativePath /> <!-- lookup parent from repository -->
  </parent>

  <properties>
    <maven.compiler.source>17</maven.compiler.source>
    <maven.compiler.target>17</maven.compiler.target>
    <project.build.sourceEncoding>UTF-8</project.build.sourceEncoding>
    <project.reporting.outputEncoding>UTF-8</project.reporting.outputEncoding>
    <jackson.version>2.16.1</jackson.version>
    <lombok.version>1.18.30</lombok.version>
    <springdoc.version>2.3.0</springdoc.version>
    <jersey.version>3.1.3</jersey.version>
    <httpclient.version>4.5.14</httpclient.version>
  </properties>

  <dependencies>
    <!-- Spring Boot Starters -->
    <dependency>
      <groupId>org.springframework.boot</groupId>
      <artifactId>spring-boot-starter-web</artifactId>
      <exclusions>
        <exclusion>
          <groupId>org.springframework.boot</groupId>
          <artifactId>spring-boot-starter-logging</artifactId>
        </exclusion>
      </exclusions>
    </dependency>
    <dependency>
      <groupId>org.springframework.boot</groupId>
      <artifactId>spring-boot-starter-actuator</artifactId>
    </dependency>
    <dependency>
      <groupId>org.springframework.boot</groupId>
      <artifactId>spring-boot-starter-thymeleaf</artifactId>
    </dependency>

    <!-- Testing -->
    <dependency>
      <groupId>org.springframework.boot</groupId>
      <artifactId>spring-boot-starter-test</artifactId>
      <scope>test</scope>
    </dependency>

    <!-- API Documentation -->
    <dependency>
      <groupId>org.springdoc</groupId>
      <artifactId>springdoc-openapi-starter-webmvc-ui</artifactId>
      <version>${springdoc.version}</version>
    </dependency>

    <!-- JSON Processing -->
    <dependency>
      <groupId>org.glassfish.jersey.core</groupId>
      <artifactId>jersey-client</artifactId>
      <version>${jersey.version}</version>
    </dependency>
    <dependency>
      <groupId>org.json</groupId>
      <artifactId>json</artifactId>
      <version>20231013</version>
    </dependency>
    <dependency>
      <groupId>com.fasterxml.jackson.core</groupId>
      <artifactId>jackson-core</artifactId>
      <version>${jackson.version}</version>
    </dependency>
    <dependency>
      <groupId>com.fasterxml.jackson.core</groupId>
      <artifactId>jackson-databind</artifactId>
      <version>${jackson.version}</version>
    </dependency>
    <dependency>
      <groupId>com.fasterxml.jackson.core</groupId>
      <artifactId>jackson-annotations</artifactId>
      <version>${jackson.version}</version>
    </dependency>

    <!-- HTTP Client -->
    <dependency>
      <groupId>org.apache.httpcomponents</groupId>
      <artifactId>httpclient</artifactId>
      <version>${httpclient.version}</version>
    </dependency>

    <!-- Development Tools -->
    <dependency>
      <groupId>org.projectlombok</groupId>
      <artifactId>lombok</artifactId>
      <version>${lombok.version}</version>
      <optional>true</optional>
    </dependency>
  </dependencies>

  <build>
    <plugins>
      <plugin>
        <groupId>org.springframework.boot</groupId>
        <artifactId>spring-boot-maven-plugin</artifactId>
        <configuration>
          <excludes>
            <exclude>
              <groupId>org.projectlombok</groupId>
              <artifactId>lombok</artifactId>
            </exclude>
          </excludes>
        </configuration>
      </plugin>
      <plugin>
        <groupId>org.apache.maven.plugins</groupId>
        <artifactId>maven-compiler-plugin</artifactId>
        <version>3.11.0</version>
        <configuration>
          <source>${maven.compiler.source}</source>
          <target>${maven.compiler.target}</target>
          <annotationProcessorPaths>
            <path>
              <groupId>org.projectlombok</groupId>
              <artifactId>lombok</artifactId>
              <version>${lombok.version}</version>
            </path>
          </annotationProcessorPaths>
        </configuration>
      </plugin>
    </plugins>
  </build>
</project>
The application.properties file stores configuration settings like the GridDB Cloud API URL and key, and the NASA POWER API URL, enabling the app to connect securely to these external services.
griddb.rest.url=https://your-griddb-cloud-url/rest
griddb.api.key=your-griddb-api-key
nasa.power.api.url=https://power.larc.nasa.gov/api/temporal/daily/point
Technical Implementation
In the following section, we’ll walk through the key steps required to set up the project.
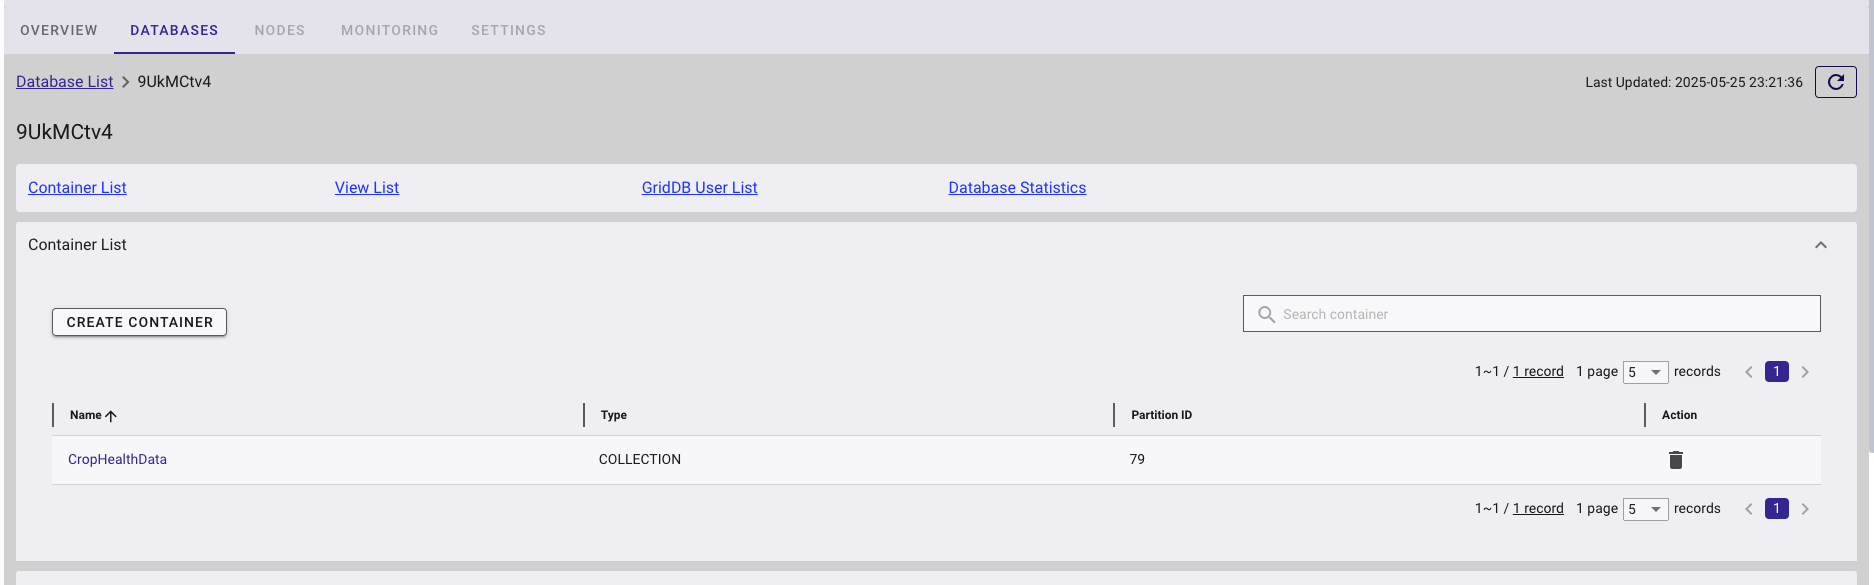
Container Setup in GridDB Cloud
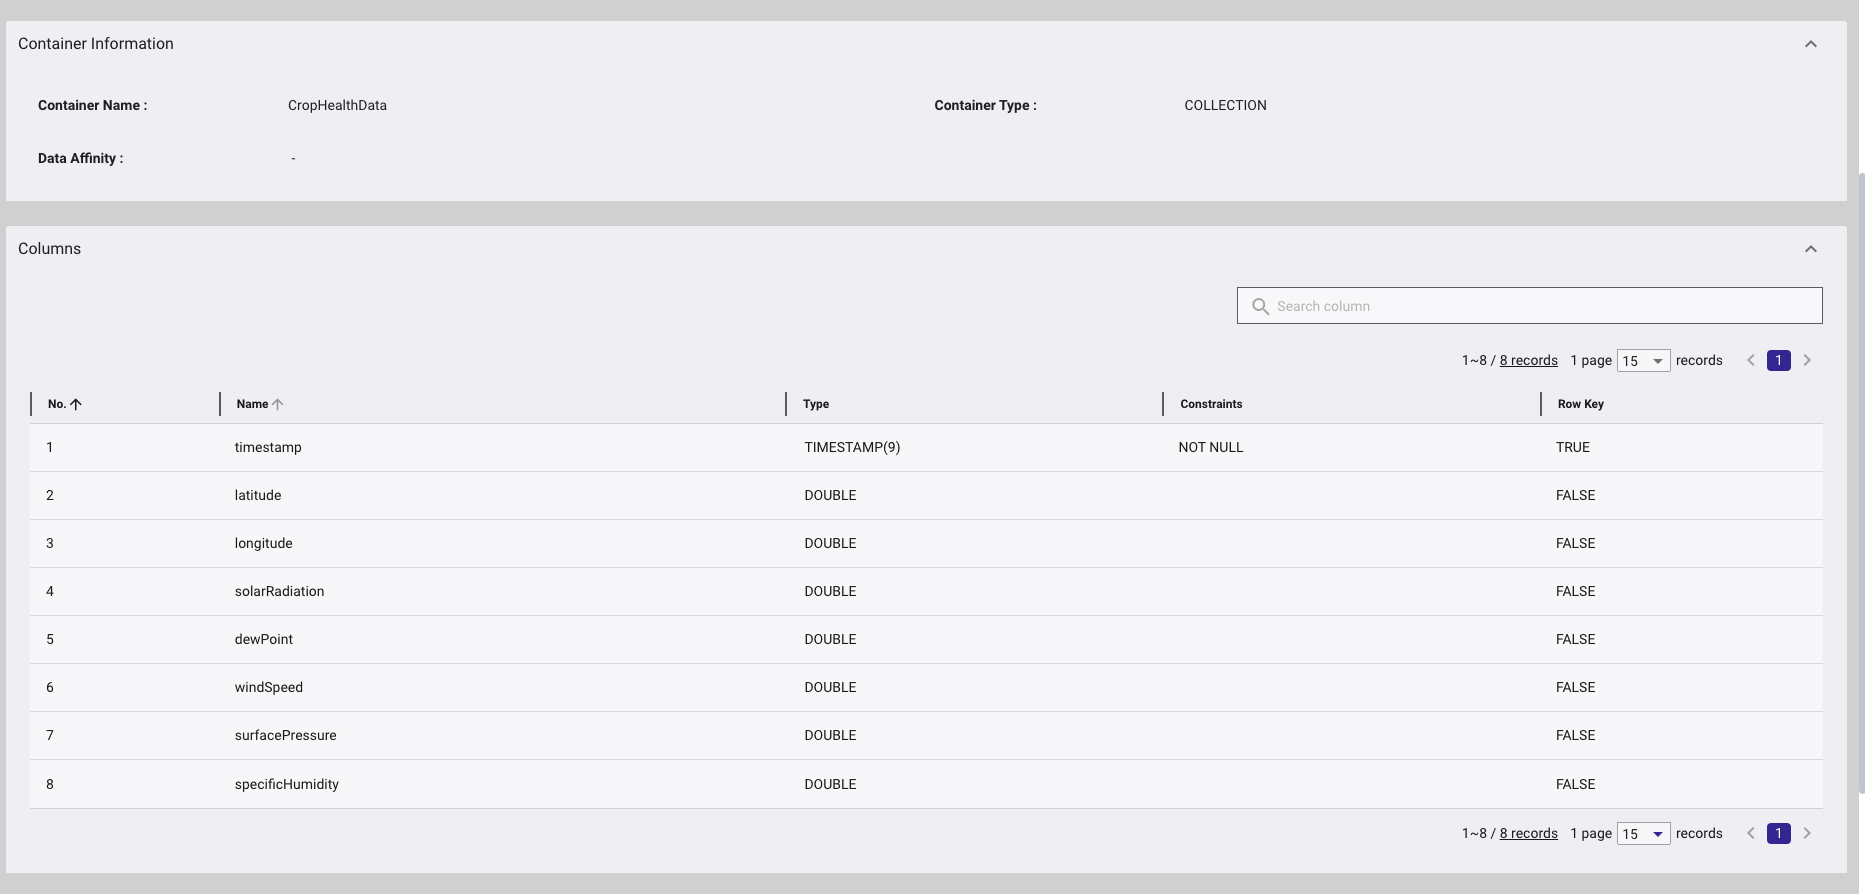
A container named CropHealthData is created in GridDB Cloud, defined as a time-series type, with timestamp set as the row key.
Next, we define the schema, which includes the following columns:
Data Collection: CollectionService
The CollectionService handles weather data ingestion by acting as the interface between external data sources and the GridDB backend. It integrates with NASA’s POWER API to retrieve daily environmental metrics crucial for monitoring crop health.
Weather Metrics
In this section, we retrieve high-precision, real-time data from an external API. The service provides access to various environmental parameters through the following endpoint:
https://power.larc.nasa.gov/api/temporal/daily/pointparameters=ALLSKY_SFC_SW_DWN,T2MDEW,WS2M,PS,QV2M&community=AG&longitude=-93.5&latitude=42.0&start=%s&end=%s&format=JSON
API Reference: NASA POWER API Documentation
Data is retrieved for a fixed geographical location (latitude: 42.0, longitude: -93.5) via a GET request to NASA’s temporal endpoint.
The parameters fetched include:
ALLSKY_SFC_SW_DWN: Solar Radiation (MJ/m²/day)T2MDEW: Dew Point (°C)WS2M: Wind Speed (m/s)PS: Surface Pressure (kPa)QV2M: Specific Humidity (g/kg)
After receiving the JSON response:
- Relevant fields are extracted.
- Timestamps are formatted to GridDB’s required pattern:
yyyy-MM-dd HH:mm:ss. - Invalid or missing values (represented as
-999) are filtered out to ensure data quality.
Here is the implementation of CollectionService.java file.
@Service
public class CollectionService {

    @Value("${nasa.power.api.url}")
    private String nasaApiUrl;

    private static String gridDBRestUrl;
    private static String gridDBApiKey;

    @Value("${griddb.rest.url}")
    public void setGridDBRestUrl(String in) {
        gridDBRestUrl = in;
    }

    @Value("${griddb.api.key}")
    public void setGridDBApiKey(String in) {
        gridDBApiKey = in;
    }

    public void fetchAndStoreData(String startDate, String endDate) {
        try {
            // Fetch JSON data from NASA POWER API
            String jsonData = fetchJSONFromNASA(String.format(
                    "%s?parameters=ALLSKY_SFC_SW_DWN,T2MDEW,WS2M,PS,QV2M&community=AG&longitude=-93.5&latitude=42.0&start=%s&end=%s&format=JSON",
                    nasaApiUrl, "20250101", "20250514"));

            // Process and send data to GridDB Cloud
            sendBatchToGridDB(jsonData);

        } catch (Exception e) {
            throw new RuntimeException("Failed to fetch and store data", e);
        }
    }

    private String fetchJSONFromNASA(String urlString) throws Exception {
        URL url = new URL(urlString);
        HttpURLConnection conn = (HttpURLConnection) url.openConnection();
        conn.setRequestMethod("GET");
        conn.setRequestProperty("Accept", "application/json");

        if (conn.getResponseCode() != 200) {
            throw new RuntimeException("Failed to fetch data: HTTP error code : " + conn.getResponseCode());
        }

        Scanner scanner = new Scanner(url.openStream());
        StringBuilder response = new StringBuilder();
        while (scanner.hasNext()) {
            response.append(scanner.nextLine());
        }
        scanner.close();
        conn.disconnect();
        return response.toString();
    }

    private void sendBatchToGridDB(String jsonData) throws Exception {
        JSONArray batchData = new JSONArray();
        ObjectMapper mapper = new ObjectMapper();
        JsonNode root = mapper.readTree(jsonData);
        JsonNode data = root.path("properties").path("parameter");
        JsonNode allSkyNode = data.path("ALLSKY_SFC_SW_DWN");

        // Iterate over the field names (dates) in ALLSKY_SFC_SW_DWN
        Iterator<String> dateIterator = allSkyNode.fieldNames();
        while (dateIterator.hasNext()) {
            String dateStr = dateIterator.next();
            double solarRadiation = allSkyNode.path(dateStr).asDouble();
            double dewPoint = data.path("T2MDEW").path(dateStr).asDouble();
            double windSpeed = data.path("WS2M").path(dateStr).asDouble();
            double surfacePressure = data.path("PS").path(dateStr).asDouble();
            double specificHumidity = data.path("QV2M").path(dateStr).asDouble();

            // Skip records with -999 (missing data)
            if (solarRadiation == -999 || dewPoint == -999 || windSpeed == -999 ||
                    surfacePressure == -999 || specificHumidity == -999) {
                continue;
            }

            JSONArray rowArray = new JSONArray();
            rowArray.put(formatTimestamp(dateStr));
            rowArray.put(42.0); // latitude
            rowArray.put(-93.5); // longitude
            rowArray.put(solarRadiation);
            rowArray.put(dewPoint);
            rowArray.put(windSpeed);
            rowArray.put(surfacePressure);
            rowArray.put(specificHumidity);
            batchData.put(rowArray);
        }

        if (batchData.length() > 0) {
            sendPutRequest(batchData);
        } else {
            System.out.println("No valid data to send to GridDB.");
        }
    }

    private String formatTimestamp(String inputTimestamp) {
        try {
            if (inputTimestamp == null || inputTimestamp.isEmpty()) {
                return LocalDateTime.now().format(DateTimeFormatter.ofPattern("yyyy-MM-dd'T'HH:mm:ss")) + "Z";
            }
            SimpleDateFormat sdf = new SimpleDateFormat("yyyyMMdd");
            SimpleDateFormat outputFormat = new SimpleDateFormat("yyyy-MM-dd'T'HH:mm:ss'Z'");
            return outputFormat.format(sdf.parse(inputTimestamp));
        } catch (Exception e) {
            return LocalDateTime.now().format(DateTimeFormatter.ofPattern("yyyy-MM-dd'T'HH:mm:ss")) + "Z";
        }
    }

    private void sendPutRequest(JSONArray batchData) throws Exception {
        URL url = new URL(gridDBRestUrl);
        HttpURLConnection conn = (HttpURLConnection) url.openConnection();
        conn.setDoOutput(true);
        conn.setRequestMethod("PUT");
        conn.setRequestProperty("Content-Type", "application/json");
        conn.setRequestProperty("Authorization", gridDBApiKey);

        // Send JSON Data
        try (var os = conn.getOutputStream()) {
            os.write(batchData.toString().getBytes());
            os.flush();
        }

        int responseCode = conn.getResponseCode();
        if (responseCode == HttpURLConnection.HTTP_OK || responseCode == HttpURLConnection.HTTP_CREATED) {
            System.out.println("Batch inserted successfully.");
        } else {
            throw new RuntimeException("Failed to insert batch. Response: " + responseCode);
        }

        conn.disconnect();
    }
}
Batch Insertion to GridDB
Next, cleaned data is sent to the CropHealthData container in GridDB using a PUT request via the /CropHealthData/row endpoint. This process:
- Utilizes batch insertion to reduce network overhead.
- Takes advantage of GridDB’s high-throughput performance, which is ideal for time-series ingestion at scale.
Reference: GridDB Performance Overview
Data Retrieval and Analytical Processing
The CropHealthService is responsible for retrieving data from GridDB and performing analytical computations to derive actionable indicators. It queries the CropHealthData container using GridDB’s REST API, which returns a JSON response with a rows array. Each row contains eight fields, with timestamps formatted as yyyy-MM-dd'T'HH:mm:ss.SSSSSSSSSZ (e.g., 2025-01-01T00:00:00.000000000Z).
The service parses this response, mapping each row to a CropHealthData DTO object.
package mycode.dto;

import lombok.AllArgsConstructor;
import lombok.Data;
import lombok.NoArgsConstructor;

import java.util.Date;

@Data
@AllArgsConstructor
@NoArgsConstructor
public class CropHealthData {
    private Date timestamp;
    private double latitude;
    private double longitude;
    private double solarRadiation;
    private double dewPoint;
    private double windSpeed;
    private double surfacePressure;
    private double specificHumidity;
    private String status;
}
This object is then used to compute five key indicators:
- Photosynthetic Stress: Identifies days with solar radiation below 10 MJ/m²/day, aggregated by month to highlight periods of reduced photosynthesis.
- Fungal Risk: Counts days with dew point above 20°C within a 7-day window, signaling potential fungal disease outbreaks.
- Wind Stress: Tracks days with wind speed exceeding 5 m/s, aggregated weekly to assess mechanical stress on crops.
- Atmospheric Stress: Detects daily surface pressure drops greater than 2 kPa, indicating weather instability.
- Moisture Deficit: Calculates weekly average specific humidity to evaluate water availability.
These indicators transform raw weather data into insights tailored for agriculture. For example, a high fungal risk score prompts farmers to apply fungicides, while persistent low radiation signals the need for supplemental lighting.
Visualization: Unified Dashboard API
Visualization is a key feature of the system, delivered through a Thymeleaf-based dashboard powered by Chart.js for dynamic, interactive charts.
The CropHealthController exposes a single API endpoint:
GET /api/dashboard-data
This endpoint calls CropHealthService.getAllVisualizationData to retrieve data for all ten charts in one JSON response.
Here is the complete implementation from CropHealthController.java file.
@Controller
@RequestMapping("/crop-health")
public class CropHealthController {

    @Autowired
    private CropHealthService cropHealthService;


    @GetMapping("/dashboard")
    public String dashboard(Model model) {
        model.addAttribute("solarRadiationData", cropHealthService.getVisualizationData("solar_radiation"));
        model.addAttribute("dewPointData", cropHealthService.getVisualizationData("dew_point"));
        model.addAttribute("windSpeedData", cropHealthService.getVisualizationData("wind_speed"));
        model.addAttribute("surfacePressureData", cropHealthService.getVisualizationData("surface_pressure"));
        model.addAttribute("specificHumidityData", cropHealthService.getVisualizationData("specific_humidity"));
        model.addAttribute("photosyntheticStressData", cropHealthService.getVisualizationData("photosynthetic_stress"));
        model.addAttribute("fungalRiskData", cropHealthService.getVisualizationData("fungal_risk"));
        model.addAttribute("windStressData", cropHealthService.getVisualizationData("wind_stress"));
        model.addAttribute("atmosphericStressData", cropHealthService.getVisualizationData("atmospheric_stress"));
        model.addAttribute("moistureDeficitData", cropHealthService.getVisualizationData("moisture_deficit"));
        return "dashboard";
    }
}
Running the Project
To run the project, execute the following command to build and run our application:
mvn clean install && mvn spring-boot:run
Accessing the Dashboard
After successfully launching the Spring Boot application, users can access the interactive visualization dashboard by opening a web browser and navigating to: `http://localhost:9090/dashboard`.
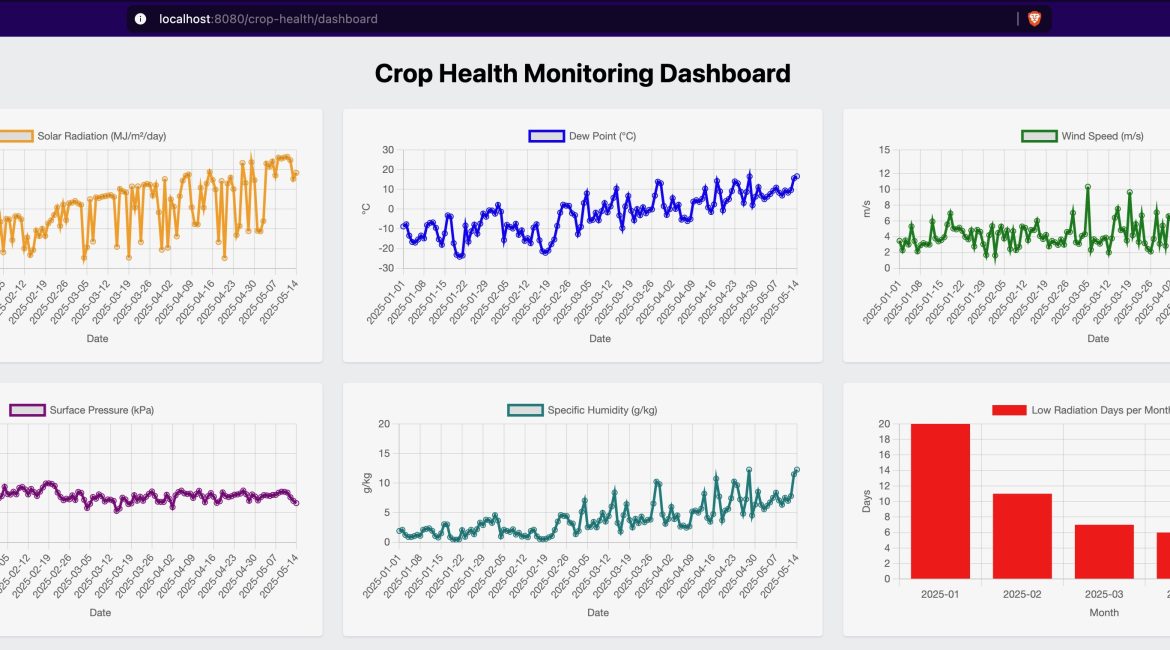
The dashboard currently showcases the following visual insights:
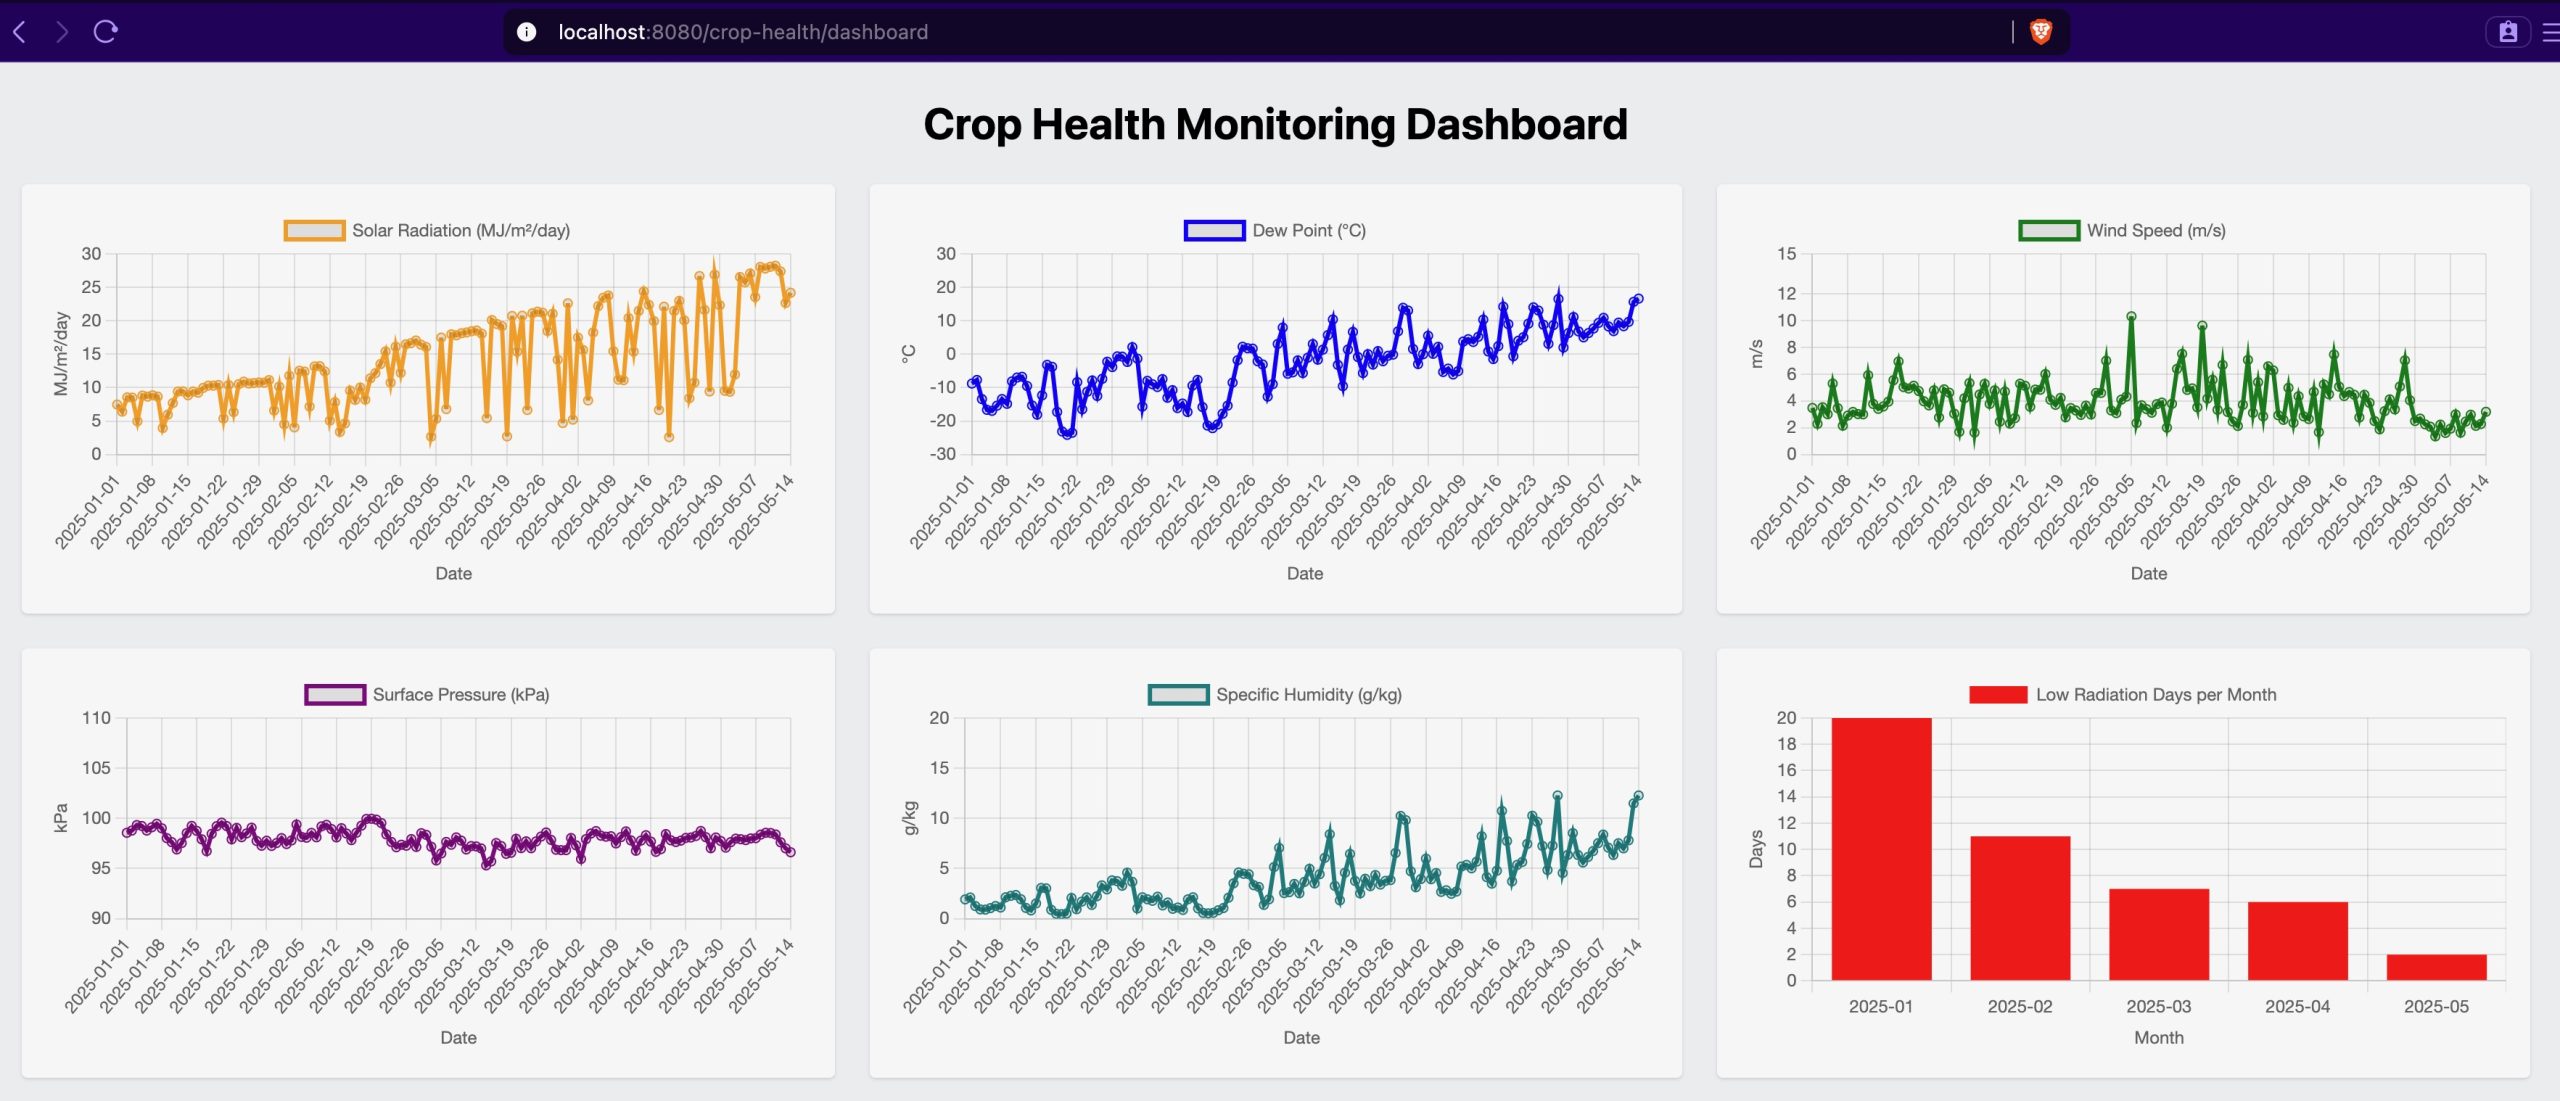
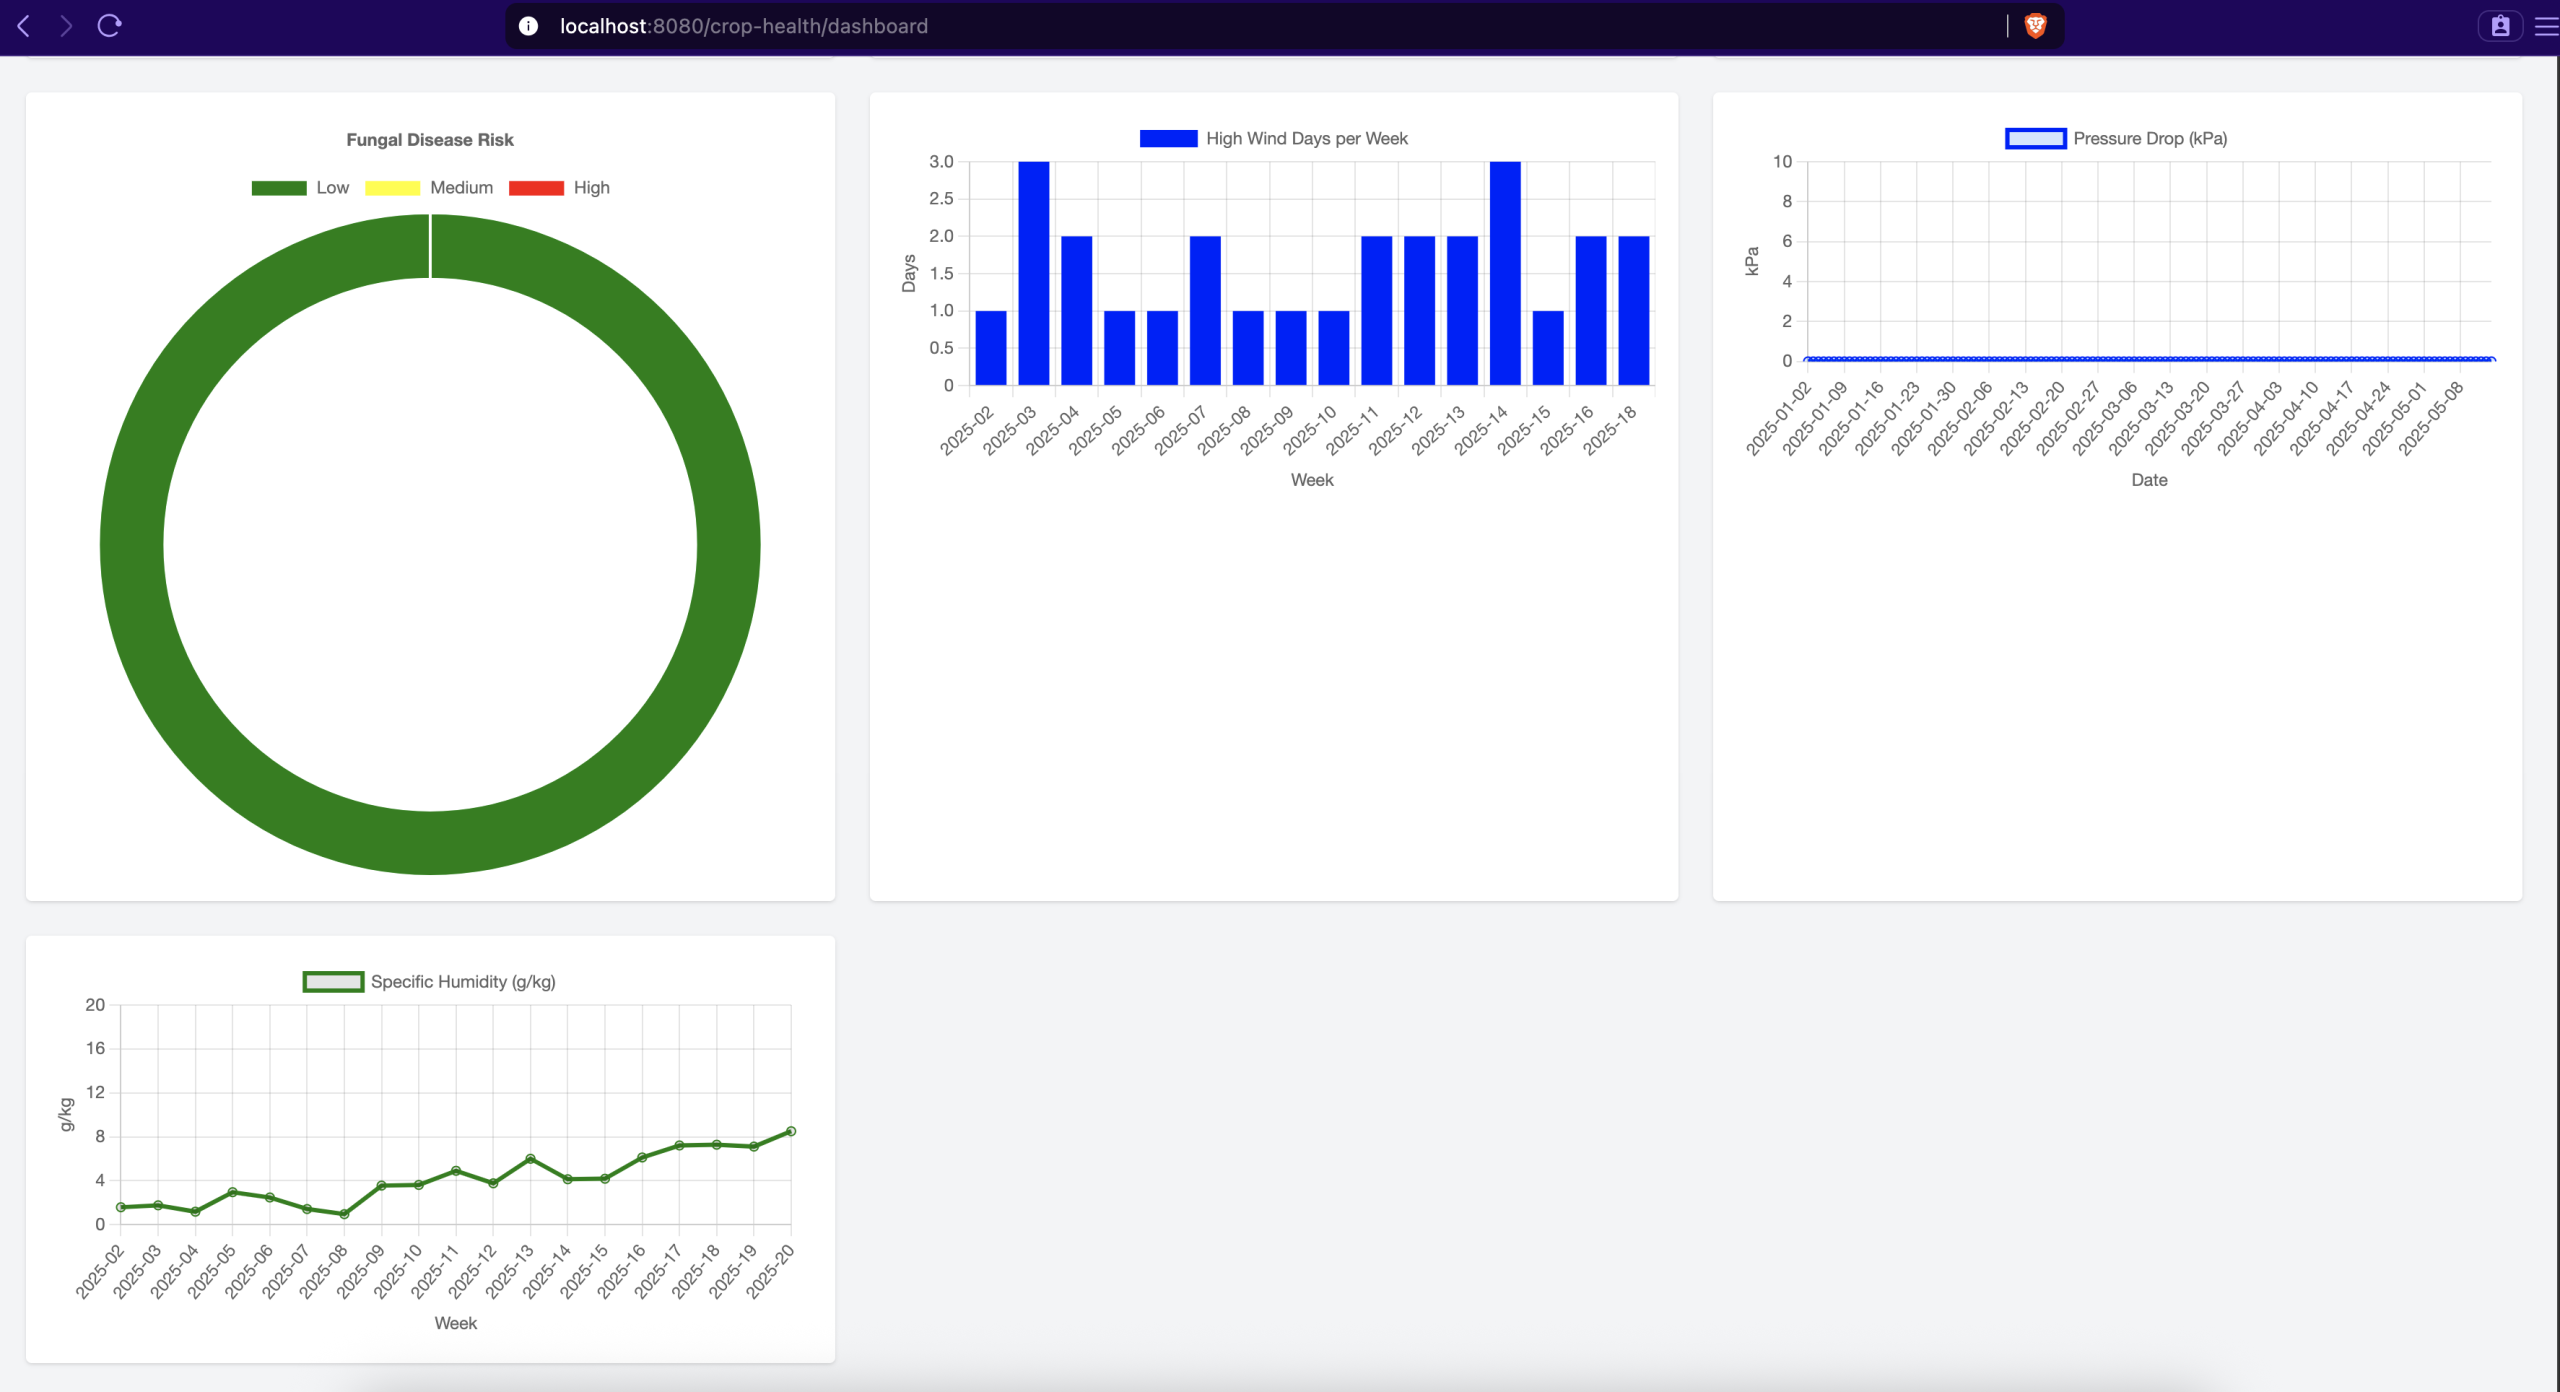
The dashboard presents a comprehensive view of crop health through ten interactive charts:
- Environmental Metrics (Line Charts)
- Solar Radiation: Daily solar radiation values in MJ/m²/day, helping identify optimal photosynthesis periods
- Dew Point: Temperature at which air becomes saturated (°C), crucial for fungal disease prediction
- Wind Speed: Daily wind measurements in m/s, indicating potential mechanical stress on crops
- Surface Pressure: Atmospheric pressure readings in kPa, showing weather stability
- Specific Humidity: Daily moisture content in g/kg, essential for irrigation planning
- Crop Stress Indicators
- Photosynthetic Stress: Monthly bar chart showing days with suboptimal radiation (< 10 MJ/m²/day)
- Fungal Risk: Gauge chart displaying 7-day dew point risk assessment (> 20°C)
- Wind Stress: Weekly bar chart tracking high wind events (> 5 m/s)
- Atmospheric Stress: Area chart highlighting significant pressure drops (> 2 kPa/day)
- Moisture Deficit: Weekly line chart of humidity averages for water management
Conclusion:
Precision farming relies on fast, accurate time-series data to make informed decisions that improve crop health and yield. By harnessing GridDB’s ability to handle large-scale, high-frequency environmental data in real time, farmers can detect stress factors early and respond proactively. This timely insight reduces waste, optimizes resource use, and ultimately leads to more sustainable and efficient agricultural practices. Fast, reliable time-series databases are essential for unlocking the full potential of precision agriculture in today’s data-driven world.
If you have any questions about the blog, please create a Stack Overflow post here https://stackoverflow.com/questions/ask?tags=griddb .
Make sure that you use the “griddb” tag so our engineers can quickly reply to your questions.