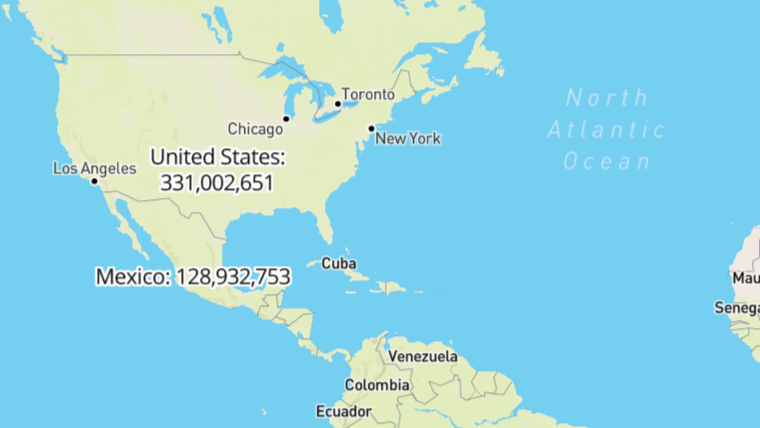
What We Will Build?
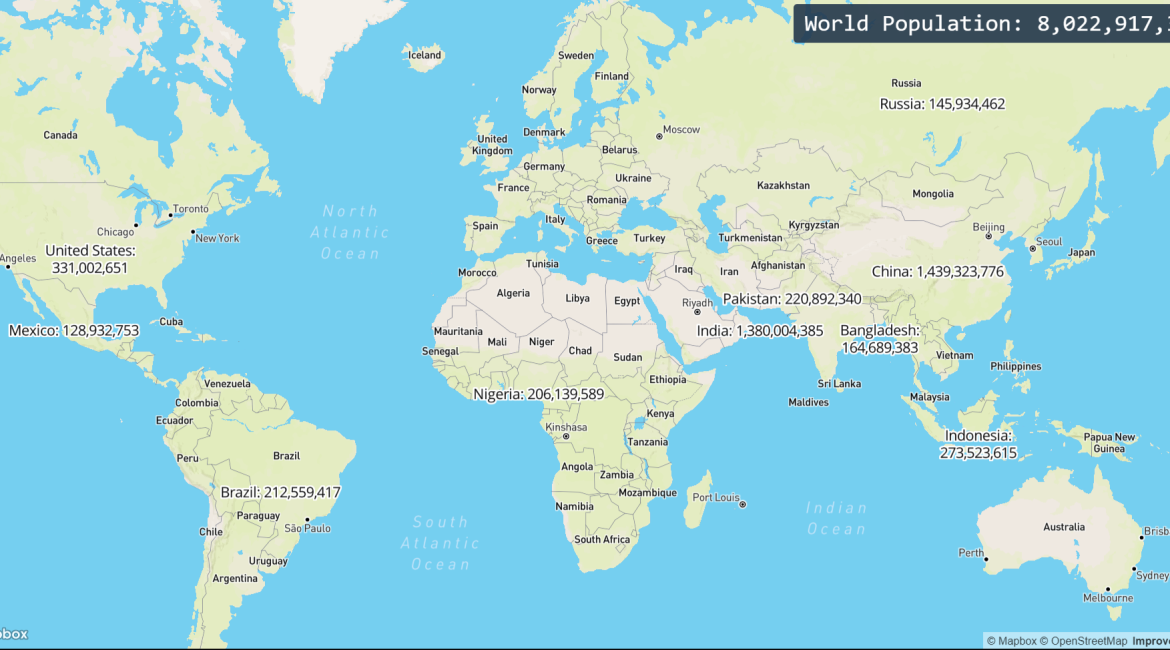
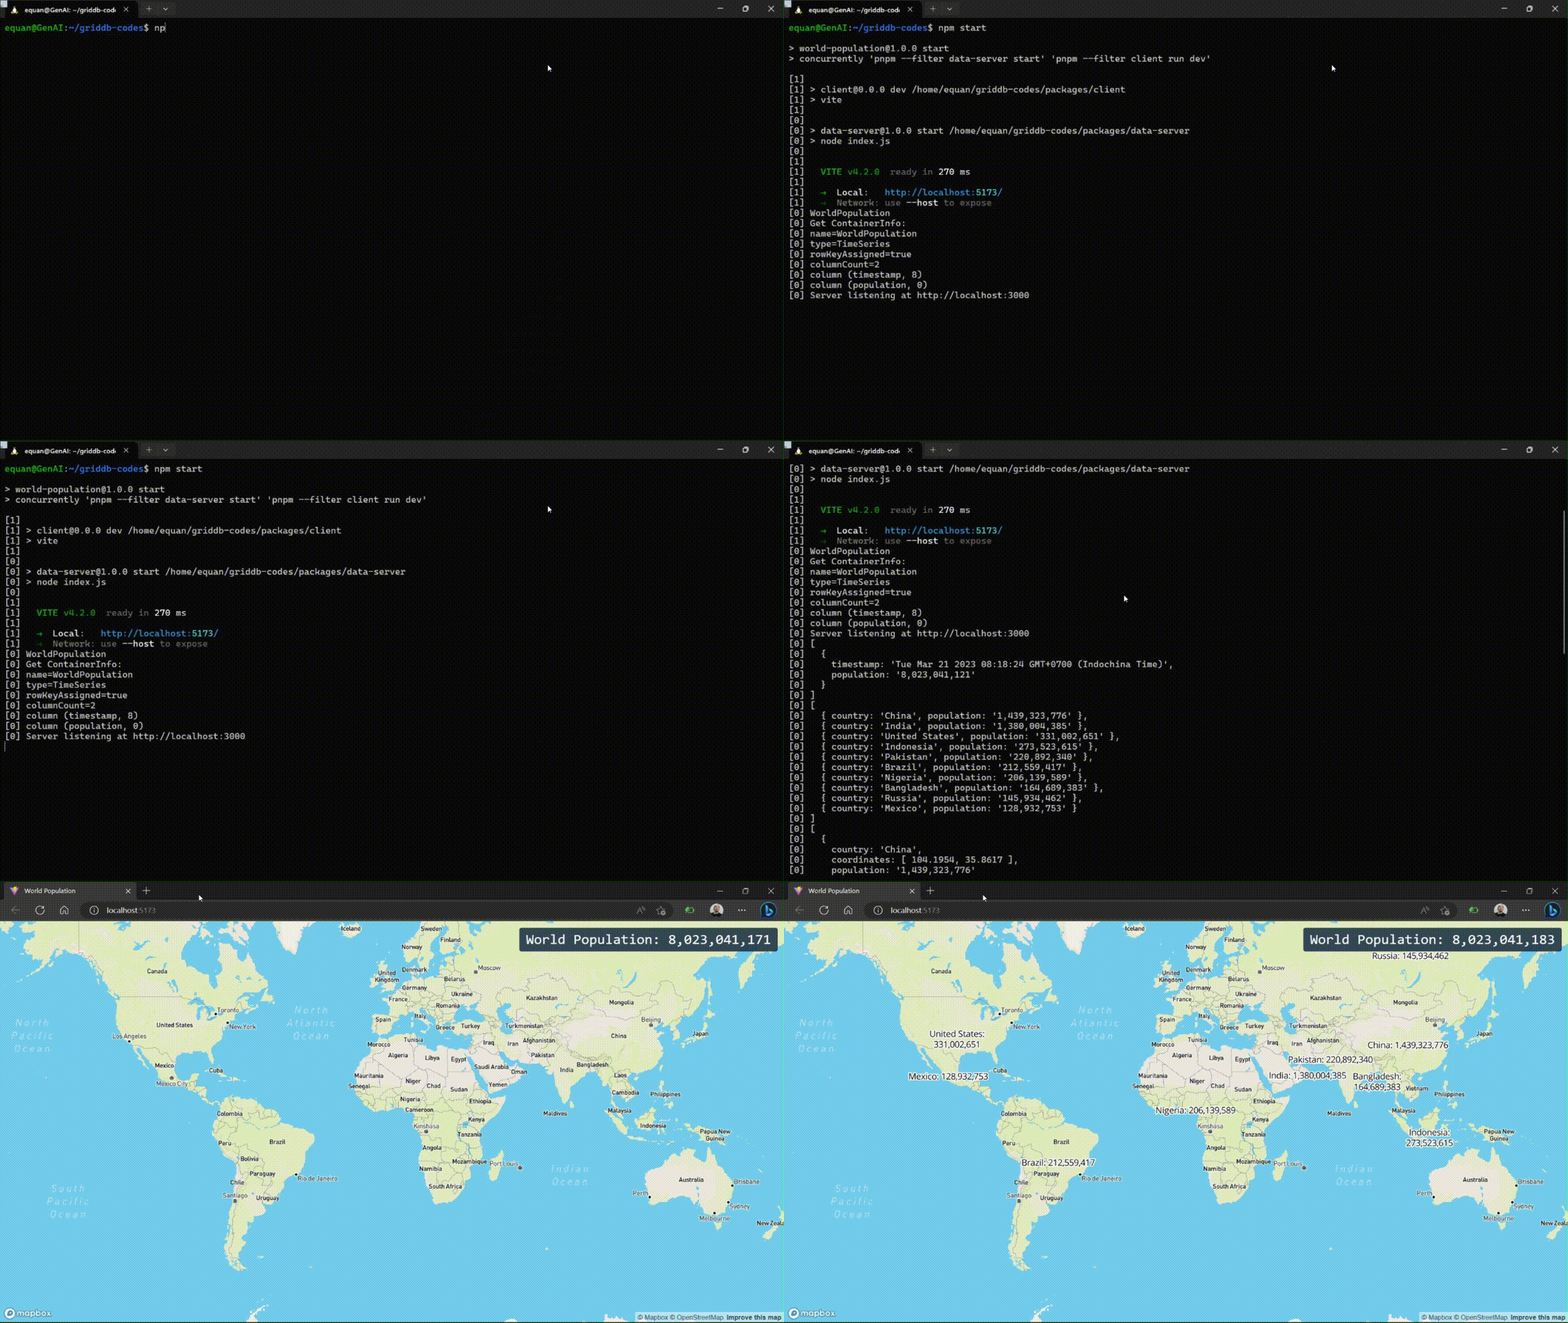
This post will show you how to create a web-based map displaying world population data. The data is extracted from worldometers and using React, Mapbox GL JS, Node.js, and GridDB to build the whole web-based map application. The world map will display the top 10 countries with the most population data.
Run the Project
To launch the project, visit the project’s repository. Clone the repository, ensure that you have Node.js version 18, install all required dependencies, and start the project.
git clone git@github.com:junwatu/griddb-codes.git

cd griddb-codes

core enable

corepack prepare pnpm@7.30.0 --activate

pnpm install

cd packages/data-server/

pnpm install

cd ../client

pnpm install

cd ../../

npm start
Go to http://localhost:5173 in the browser to open the web map.
The Development Flow
The development flow for this project can be breakdown into a few steps:
Data Acquisition
First, we need to get real-time data from worldometers. We can get the data by scrapping the website or using API and then getting the needed data.
The data will be extracted at regular intervals and then stored in the GridDB database. The data stored can be used for further analysis, prediction, reporting, etc.
Back-end Development
We will use Node.js to code the server-side application server.
Why Node.js?
JavaScript is the lingua franca for full-stack application development, so it’s the obvious choice.
The application server we make is WebSocket-based, and Node.js will interact with GridDB for data storage, handle retrieval data from worldometers, and handle requests and responses from the client UI.
Front-end Development
We use React.js to create the user interface and to display the world population data visually, we’ll use Mapbox GL JS, a powerful mapping library. This library enables the creation of interactive, customizable maps. We’ll integrate Mapbox GL JS with our React application to render a world map with labels representing the population data.
Prerequisite
Before we code the application, we need to set up the software and tools for development. We use Ubuntu 20.04 on WSL 2 on Windows 11 OS.
WSL is only available on Windows 10 version 2004 and higher (Build 19041 and higher). Go ahead to this link for a new WSL installation.
GridDB
GridDB™ is a highly scalable, in-memory NoSQL time-series database optimized for IoT and Big Data. What’s important to note is it has two types of container categories:
Collection Containers
This type of container is similar to a traditional relational database. The data is stored as key values, and the collection container support basic CRUD (Create, Read, Update, and Delete) operation.
TimeSeries Containers
This container is designed explicitly for managing time-series data, a sequence of data points indexed by time. Each record in a TimeSeries container has a timestamp, which serves as its unique key, and the data in this container is “append only” except upon deletion if requested.
Installation
To install GridDB on WSL there are a few things that we should know.
⚠️ GridDB deb package uses systemd, but Ubuntu 20.04 on WSL 2 Windows 11 uses SysVinit, so you need to enable systemd on Ubuntu WSL by editing the file /etc/wsl.conf (create it if this file doesn’t exist)
Inside your Ubuntu instance, add the following modification to /etc/wsl.conf1
[boot]
systemd=true
Open the Windows terminal to restart wsl with the following command.
wsl --shutdownThen start wsl again with the command.
wslTo install GridDB, follow the installation instruction on https://docs.griddb.net/latest/gettingstarted/using-apt/#install-with-apt-get.
Run GridDB and check if the service is running. Use this command
sudo systemctl status gridstoreAnd if everything ok you will get a message like this.
● gridstore.service - GridDB database server.
     Loaded: loaded (/lib/systemd/system/gridstore.service; enabled; vendor preset: enabled)
     Active: active (running) since Thu 2023-03-16 18:56:13 +07; 58min ago
    Process: 314 ExecStart=/usr/griddb/bin/gridstore start (code=exited, status=0/SUCCESS)
   Main PID: 393 (gsserver)
      Tasks: 34 (limit: 4605)
     Memory: 138.5M
        CPU: 20.129s
     CGroup: /system.slice/gridstore.service
             └─393 /usr/bin/gsserver --conf /var/lib/gridstore/conf

Mar 16 18:56:10 GenAI systemd[1]: Starting GridDB database server....
Mar 16 18:56:10 GenAI gridstore[314]: Starting gridstore service:
Mar 16 18:56:13 GenAI gridstore[392]: ..
Mar 16 18:56:13 GenAI gridstore[392]: Started node.
Mar 16 18:56:13 GenAI gridstore[314]: [ OK ]
Mar 16 18:56:13 GenAI systemd[1]: Started GridDB database server..
No need to start GridDB manually because on every OS reboot, this service will go up.
Node.js
To install2 Node.js LTS, follow the commands below
curl -fsSL https://deb.nodesource.com/setup_18.x | sudo -E bash - &&
sudo apt-get install -y nodejs
We will be using griddb node-api to connect our application with GridDB, but before that, we should install the griddb c client. The GridDB C Client provides a C interface for GridDB.
wget https://github.com/griddb/c_client/releases/download/v5.0.0/griddb-c-client_5.0.0_amd64.deb
sudo dpkg -i griddb-c-client_5.0.0_amd64.deb
GridDB node-api
To connect to GridDB from Node.js, we should use griddb-node-api. This package is built using node-addon-api, and there are two ways to use it:
1. Compile from the source code. This way is the right way if you need to use griddb-node-api on a specific node.js version.
git clone git@github.com:griddb/node-api.git
cd node-api
npm install
If there is an error message like this
gyp ERR! stack Error: not found: makeThat means you should install the build-essentials package in Ubuntu, and if everything success you will get a file, griddb.node, and then you need to include it in NODE_PATH
export NODE_PATH=$(pwd)2. Install the npm package griddb-node-api directly into our project.
npm install griddb-node-apiWe will use the second way for our project because it’s simpler, and we use Node 18 LTS.
VSCode
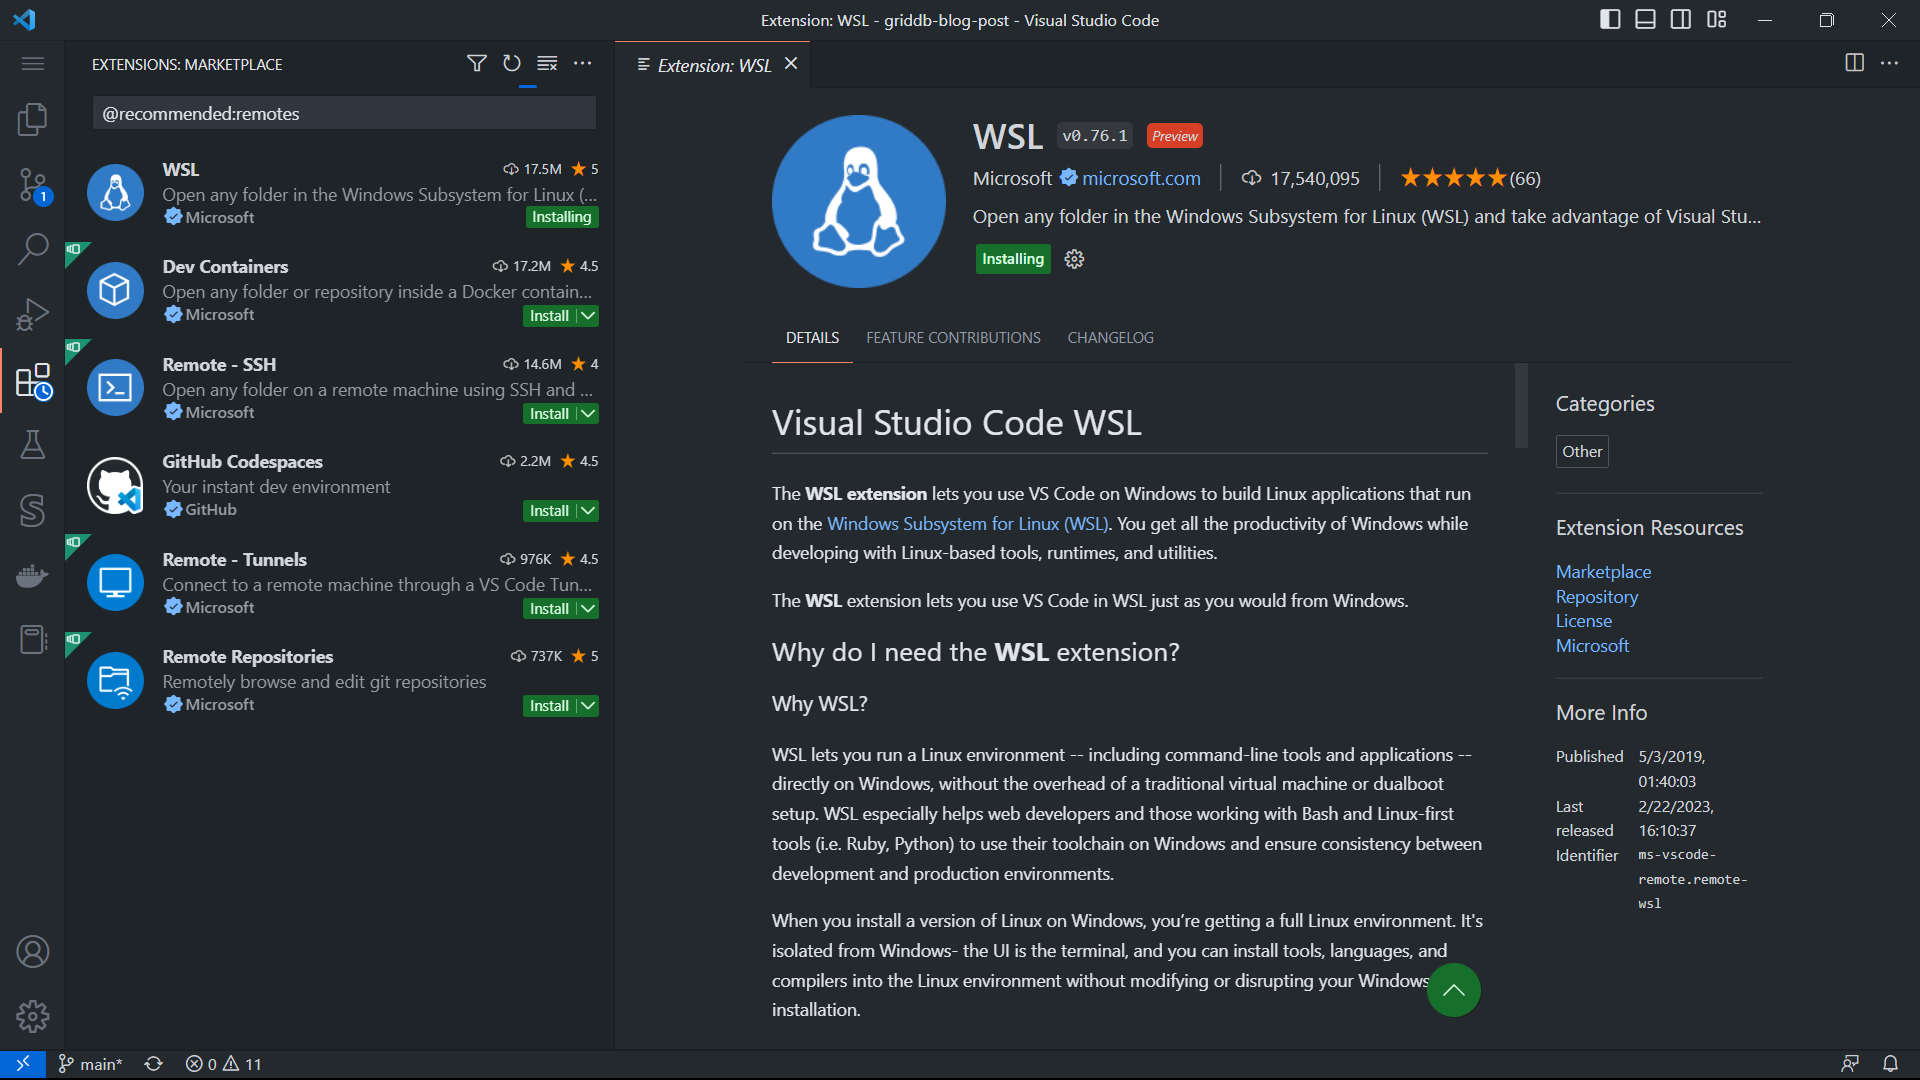
As stated earlier, we use OS Ubuntu 20.04 on WSL Windows 11. To code from Windows, we use Visual Studio Code because it has a remarkable remote WSL plugin
Ok. That’s a long setup before we code the application itself, but it’s necessary so our development environment is transparent.
Project Structure Directory
We use pnpm instead of npm because pnpm is storage efficient and supports workspaces. We will create a monorepo that holds server and client codes.
To activate pnpm use corepack from Node.js
corepack prepare pnpm@7.30.0 --activateWhy monorepo?
Because it’s good for future development, if you want to add another collaborator, everyone will be working on the same code base.
Start the project by creating a directory for the monorepo
mkdir world-population
cd world-population
pnpm init
Then create packages directory that will hold our project codes. Server code in data-server directory and client code in client directory.
mkdir packages
mkdir packages/data-server
mkdir packages/client
pnpm handling project workspaces by reading the config from pnpm-workspaces.yaml, so you need to create it and fill with the content below.
# pnpm-workspaces.yaml
packages:
  # all packages in direct subdirs of packages/
  - "packages/*
This tree structure might be typical of a Node.js project that has separate client and server codebases. Organized as packages within a monorepo and managed with the pnpm package manager.
.
├── .gitignore
├── package.json
├── packages
│   ├── data-server
│   └── client
└── pnpm-workspaces.yaml
Let’s Code
The first thing to do is initialize the server project and install the main npm packages.
cd packages/data-server
pnpm init
cd ../../
pnpm --filter data-server install griddb-node-api express ws puppeteer
Data Extraction
This project uses data from Worldometers.
Worldometers is a website that provides real-time statistics on various topics, including world population, government and economics, society and media, the environment, food, water, energy, and health.
To get data from a website there are a few ways we can use:
- Using API
- Scraping
Unfortunately, Worldometers does not provide API, so our last option is to scrap the website.
One thing to note is Worldometers have dynamic data, meaning they provide real-time data. You cannot use JavaScript libraries such as Cheerio for data extraction. The best choice is to use Puppeteer to get such dynamic content.
Puppeteer can be more resource-intensive as it launches a headless browser instance to render web pages. However, it offers more capabilities, such as handling dynamic content and user interactions.
Two endpoint URLs will provide us with the data. One is for the total world population, and the second is for the total world population by country.
- https://www.worldometers.info/world-population/
- https://www.worldometers.info/world-population/population-by-country/
const worldPopDataSource = "https://www.worldometers.info/world-population/";
/**
 * fetch world population data
 */
const fetchWorldPopulationData = async () => {
  const browser = await puppeteer.launch();
  const page = await browser.newPage();

  await page.goto(worldPopDataSource);

  const extractData = async () => {
    // Extract data from the page
    const data = await page.evaluate(() => {
      const populationElement = document.querySelector(".rts-counter");
      const population = populationElement.textContent.replace(/[ns]+/g, "");
      return { population };
    });

    return data;
  };

  const popData = await extractData();
  await browser.close();

  return popData;
};
The data returned by fetchWorldPopulationData function is simply a JavaScript object.
{
  type: 'worldPopulationData',
  worldPopulation: {
    population: '8,022,758,957',
    timestamp: 1679222700112
  }
}
The code for data extraction of world population by country is in the repository project.
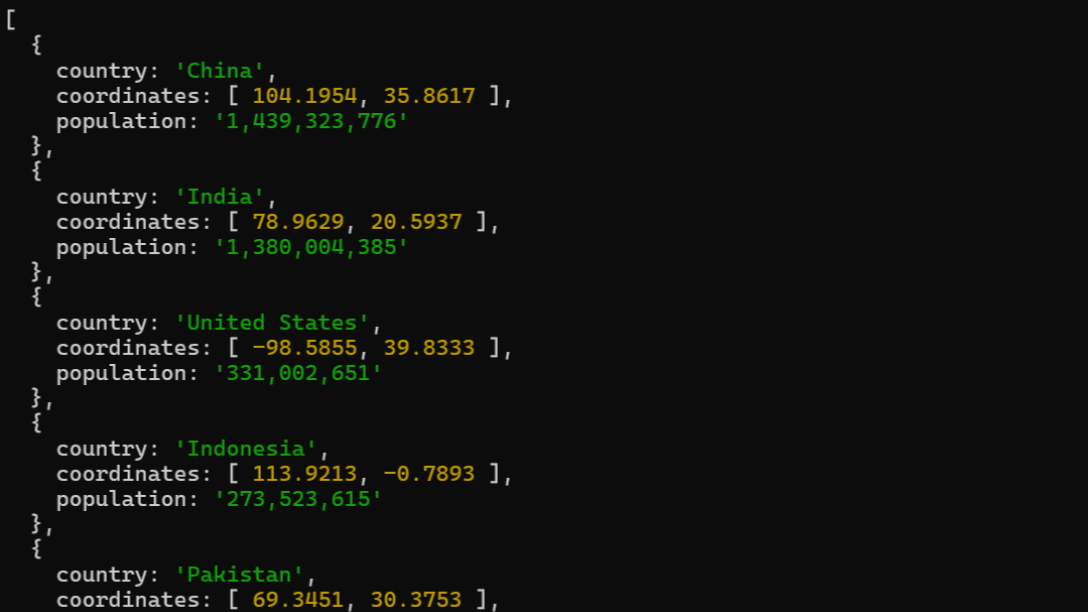
The output will be an array, with keys: country name, country coordinate and the population.
Data Store
We will use time-series containers for storing world population data. As with any other database, we need to connect to it first. On GridDB, we need to connect to the cluster.
You can see the cluster configuration at
/var/lib/gridstore/conf/gs_cluster.jsonAnd make sure that the port we put in the code is the value of the transaction key because there are a few ports there.
const initStore = async () => {
  const factory = griddb.StoreFactory.getInstance();
  try {
    // Connect to GridDB Cluster
    const store = await factory.getStore({
      host: "127.0.0.1",
      port: 10001,
      clusterName: "myCluster",
      username: "admin",
      password: "admin",
    });
    return store;
  } catch (e) {
    throw e;
  }
};
After that, we need to create a container to store our data. The initContainer() function provides information about the container’s schema, including the names and data types of its columns.
function initContainer() {
  const conInfo = new griddb.ContainerInfo({
    name: containerName,
    columnInfoList: [
      ["timestamp", griddb.Type.TIMESTAMP],
      ["value", griddb.Type.DOUBLE],
    ],
    type: griddb.ContainerType.TIME_SERIES,
  });

  return conInfo;
}
Please note that the initContainer() function will not create a container. To create a container, GridDB API provide us with putContainer() function.
async function createContainer(store, conInfo) {
  try {
    const timeSeriesDB = await store.putContainer(conInfo);
    return timeSeriesDB;
  } catch (err) {
    console.error(err);
    throw err;
  }
}
How to Store the Data
Store the data is pretty easy. First, get the container connection, then use put() to save the data into the GridDB container.
db.put(data);db is the connection reference that is returned by createConnection() function.
The important thing to note for this project is the data should be stored periodically. The simplest way to do this is by using JavaScript native function, setInterval().
function updateClientsWithWorldPopulationDataPeriodically(clients) {
  updateClientsWithWorldPopulationData(clients);
  setTimeout(
    () => updateClientsWithWorldPopulationDataPeriodically(clients),
    worldDataUpdateTime
  );
}

// Call the function to start the periodic updates
updateClientsWithWorldPopulationDataPeriodically(wss.clients);
The default time to extract data is set by variable worldDataUpdateTime which is 5 second. Means that, every 5 second we update the data.
Read Data from GridDB
GridDB supports SQL, so you can use raw SQL to retrieve the data. By using query() and fetch() we can easily get the data based on a SQL query.
async function queryAll(db) {
  const query = db.query(
    `SELECT * FROM ${containerName} ORDER BY timestamp DESC LIMIT 1`
  );

  try {
    const rowset = await query.fetch();
    const results = [];

    while (rowset.hasNext()) {
      const row = rowset.next();
      const rowData = { timestamp: `${row[0]}`, population: row[1] };
      results.push(rowData);
    }

    return results;
  } catch (err) {
    console.log(err);
    throw err;
  }
}
For the projet purposes, it need to display the latest data with the latest time stamp. We can use SQL queries to achieve this.
sql
SELECT * FROM [containerName] ORDER BY timestamp DESC LIMIT 1
Deliver Data to the Web Client
We use WebSocket to deliver data to the project web client, built with React and Mapbox.
Why WebSocket?
WebSocket is the optimal choice for applications requiring intensive data usage because it enables real-time, bidirectional communication between the client and server. WebSocket allows for efficient data transfer and minimizes latency, which is essential in data-intensive applications where continuous updates and rapid responsiveness are crucial.
This snippet code shows us how the world population data is saved to and queried from GridDB and then sent it to the web client via WebSocket ws.
const worldPopData = [worldPopulation.timestamp, worldPopulation.population];
await GridDB.insert(worldPopData, timeSeriesDb);

const result = await GridDB.queryAll(timeSeriesDb);

const jsonArray = result.map((item) => {
  return {
    timestamp: item.timestamp.toString(),
    population: item.population,
  };
});

// client is WebSocket client
clients.forEach((client) => {
  if (client.readyState === WebSocket.OPEN) {
    try {
      client.send(JSON.stringify(jsonArray));
    } catch (error) {
      console.error("Error sending data to client:", error);
    }
  }
});
In this project, we use ws for WebSocket and express.js for HTTP server.
Web Client React + Mapbox GL JS
There are so many tools today for creating React-based applications. Vite is a next-generation front-end tool. It offers enhanced speed, supports ESM, and React. Making it a standout choice.
To create a new frontend project using Vite.
pnpm create vite
cd client
pnpm install
The command will ask you a few questions and make sure to choose JavaScript and React. The source code for web client is live inside the folder packages/client.
The client side project structure.
.
├── index.html
├── node_modules
├── package.json
├── pnpm-lock.yaml
├── public
│   └── vite.svg
├── src
│   ├── App.css
│   ├── App.jsx
│   ├── assets
│   │   └── react.svg
│   ├── index.css
│   └── main.jsx
└── vite.config.js
There is not much to change in the files or directories created by Vite, except App.jsx and index.css files.
App.jsx is where we code our react component and UI for Mapbox. There are only two components. One is sidebar to show the total world population, and the second is map-container to display the world map and label each country’s total population.
<div className="App">
  <div className="sidebar">World Population: {worldPopulation}</div>
  <div ref="{mapContainer}" className="map-container" />
</div>
Mapbox GL JS
Mapbox GL JS is a JavaScript library for vector maps on the web. Its performance, real-time styling, and interactivity features set the bar for anyone building fast and immersive web maps.
Add Mapbox GL JS to our client-side application.
pnpm install mapbox-glSince modern browsers already support WebSocket natively, we don’t need an additional package to connect to our WebSocket server.
const ws = new WebSocket("ws://localhost:3000");
setSocket(ws);
And to get the world population data, just listen to message event
ws.addEventListener("message", (event) => {
  const data = JSON.parse(event.data);

  if (data[0].country) {
    console.log("country", data);
    updateLabels(data);
  } else {
    setWorldPopulation(data[0].population);
  }
});
updateLabels(data) function will update every country’s label in the top 10 world population.
React
With React, we can build components easily. For this project, we use it for creating a sidebar.
This UI shows the total world population. Using React useState, every data update from WebSocket will trigger and render new data on the sidebar.
const [worldPopulation, setWorldPopulation] = useState(0);

//...//

ws.addEventListener("message", (event) => {
  const data = JSON.parse(event.data);

  if (data[0].country) {
    console.log("country", data);
    updateLabels(data);
  } else {
    setWorldPopulation(data[0].population);
  }
});
Conceptually, this project appears straightforward. However, the implementation of a web application to visualize global population data using Mapbox, Node.js, and GridDB with real-time live data integration and live UI updates presents a more complex challenge. The real-world nature of the data and the dynamic aspects of the application add multiple layers of complexity, making it a non-trivial task to execute effectively.
If you have any questions about the blog, please create a Stack Overflow post here https://stackoverflow.com/questions/ask?tags=griddb .
Make sure that you use the “griddb” tag so our engineers can quickly reply to your questions.
