過去のデータを取得する
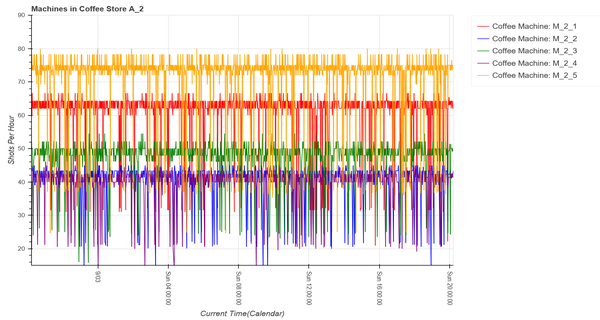
ショットレート
過去のショットレートを取得してプロットするためには、ショットレート時系列データのxrangeにコールバック関数を追加します。 ユーザーがグラフを左に移動すると、範囲の開始点(start)が変更されます。
for index in range(len(line_sources)):
	timestamps = GridstoreMethods.fetch_timestamps_betw(gridstore, \
	serial_numbers[index],int(new),int(timestamp), filtered = True)

	get_past_readings(gridstore,line_sources[index],serial_numbers[index],\
	timestamps,SHOT_RATE)
グラフのすべてのラインについて、新しい開始点(start)とラインソースの始点の間のすべてのタイムスタンプレコードを取得し、グラフ上に記録され、記録プロットされた最も早い日付を取得します。 つまり、プロットのギャップを埋めるために必要なすべてのタイムスタンプレコードを取得します。これはfetch_timestamp_betw()関数で実現されます。
この関数は、エスプレッソショットが成功した2つのタイムスタンプ(event_type = 1)間のすべてのタイムスタンプレコードに対してtqlクエリーを発行し、それらの行とプットのすべてのタイムスタンプをリストにまとめます。
"select * where event_type=" + str(setting) + " and timestamp >= TO_TIMESTAMP_MS(" + str(start) +
") and timestamp <= TO_TIMESTAMP_MS(" + str(end) + ") order by timestamp desc"
そこから過去のすべてのタイムスタンプを繰り返し処理し、get_instantaneous_rate関数を実行して過去の瞬間ショットレートを取得します。
y_val = GridstoreMethods.get_instantaneous_rate(coffee_machine,timestamp)

def get_instantaneous_rate(coffee_machine,timestamp = griddb.Timestamp_current())
….
   	pastql = "select * where event_type=1 AND timestamp < TO_TIMESTAMP_MS(“ +
	str(timestamp) + “) order by timestamp desc limit 1"

   	past_timestamp = past_row.get_field_as_timestamp(0)
   	delta = ( timestamp - past_timestamp ) / ( 1000 )
   	rate = ( 1 / float(delta) ) * 3600
2つのレコードでショットレートを推定する方法は、それらの間の時間間隔を計算することです。 イベントが成功し、タイムスタンプの前にある行に対して、tqlクエリを発行します。 次に、行を取得し、タイムスタンプを取得します。 そこから、それらの差をミリ秒単位で取得し、ショットレートを計算します。
新しいショットレートと過去のタイムスタンプを取得すると、それらのデータポイントがプロットのラインソースに追加され、次のサーバーコールバックで更新されます。
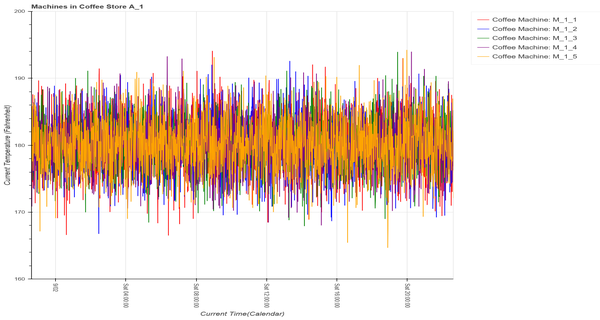
過去の温度の記録を取得する
過去の温度を取り出すのは、非常によく似たイベントの流れになります。ユーザーは左にグラフを移動し、xrangeisから新しい開始点を抽出します。 fetch_timestamps_betwの呼び出しは、ギャップを埋めるために必要なタイムスタンプレコードを取得するために行われます。
get_past_readings()で各タイムスタンプレコードに対応する温度が見つけられ、温度フィールドが抽出されます。
y_val = GridstoreMethods.get_recent_readings(gridstore,serial_numbers[index],\
int(timestamp))["temperature"]

tql = "select * where timestamp <= TO_TIMESTAMP_MS(“ + str(timestamp) +
“) order by timestamp desc limit 1"…...

temperature = row.get_field_as_float(2)
ソースコード
以下のリンクから、データ生成クライアントおよびデータ視覚化コンポーネントのアプリケーションおよびそのソースコードをダウンロードできます。
Download: datavisualisation_application.tar.gz