Over time, numerous programming languages have emerged, wherein, some gained in popularity over time while others got outdated as technology advanced. But how can we understand this rise and fall of popularity of different programming languages? How can we know which language is mostly in use in today’s time, so that we can tell which are worth investing our time in?
We came across the data from Stack Overflow, a popular question and answer site among the programmers with over 16 million questions on various programming areas.Stack Exchange Data Explorer allows us to query data out of the Stack Overflow database and save it as a dataset. You can easily find the dataset available here. Each question contains a tag that describes its topic or programming language. For instance, there are tags for different languages such as ‘Java’, ‘C’, ‘python’ as well as libraries such as ‘ggplot’, ‘matplotlib’, ‘pandas’ etc. By using the number of tags associated with each technology, we can get a sense of the popularity of that technology. So let’s explore the data and find out more about the rise and fall of programming languages.
Exporting and Import dataset using GridDB
We will be using GridDB to store our dataset as it provides a highly scalable, in-memory NoSQL time-series database optimised for IoT and big data. It uses in-memory data architecture and parallel processing for higher performance and efficiency. You can find the guide to download GridDB on different operating systems from their official website.
GridDB-Python client enables us to connect the dataset and import or export the data in real-time. We would be using some of the python libraries to preprocess data before inserting it into the GridDB in order for it to perform effectively.
Preprocessing
First of all, we will be loading our dataset using the command from pandas library. Pandas is a vastly used python library especially when dealing with datasets and analysis.

The dataset is now saved in the form of a dataframe into the variable “language_tag_unprocessed”.
There are four columns currently in our dataframe:
1.year – The year in which these tags were used
2.tag – The name of the tag that was used in the question
3.number – The number of times that tag was used in that particular year
4.year_total – The total number of tags in that particular year
If we dive deep into the dataset we would come across some null values in the ‘tag’ column that interrupts our analysis. In order to deal with it, we would be replacing the null values with the string “No tag”.

We will also need to introduce a primary key column that would help us with keeping track of each row individually.

Now we have completed our preprocessing and would save the dataframe as csv to export it to GridDB.

Exporting Dataset into GridDB:
We would again use pandas to read the csv and save it into the dataframe:

Now, we will create a container to pass our column info to the GridDB to be able to generate the design of the database before inserting the row information.
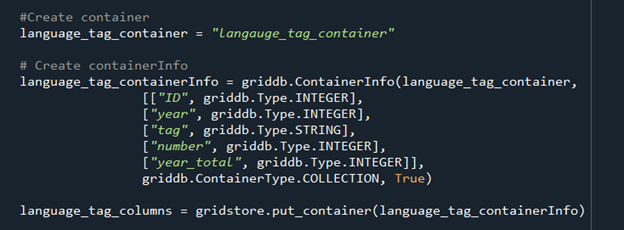
Now that we have our database design constructed, we can easily insert our data into the GridDB.

Importing Dataset from GridDB:
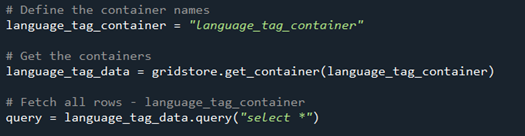
Importing a Dataset from GridDB is as simple as importing from any other database. It uses TQL to query data from GridDB equivalent to SQL commands. Before fetching the data, we would create the container to extract rows of data into, before saving it into a dataframe.
Next step would be to extract the rows in order of the column info and convert it into a dataframe to use for analysis.
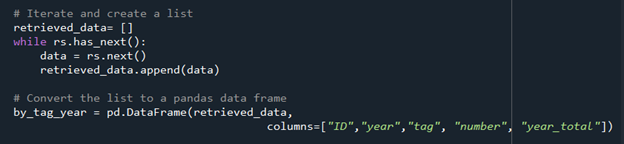
We now have our data saved into pandas dataframe “by_tag_year” and can continue to use it for our data analysis and visualisation.
Data Analysis and Visualisation:
Before starting with our analysis, we would introduce a new column as “fraction” that would just be the number of particular tags in a year divided by the total tags in that year, so that we are able to compare the popularity of the “tag” in that year.
Let’s start with the language that is now popular among most people, Python and compare how it gained recognition over time. We would extract the rows where the tag is “python” and plot it over the years 2008-2018 against “fraction”.
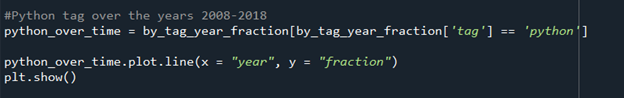
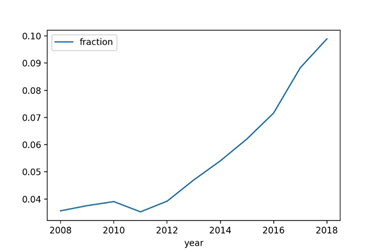
Figure 1: tag- “python” over ten years
After looking into the above graph we can surely conclude that after 2012, python has gained a vast popularity. Next, we would analyse some of the important python libraries that are mostly used by computer scientists nowadays and compare them with each other over the ten year’s time period.
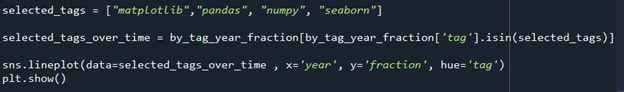
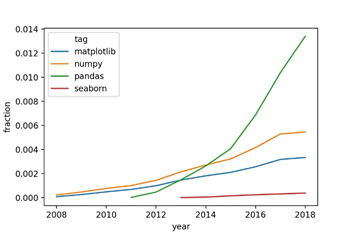
Figure 2: Python libraries over ten years
With the rise in usage of Python after 2012, python libraries also gained some popularity, especially pandas. Pandas is vastly used by data scientists, statisticians, researchers and applied scientists for analysis of collected data.
Lastly, we would explore the top six tags over ten years and how they have evolved with time. In order to extract the top tags, we will have to perform some calculations and sort the tags in descending order.
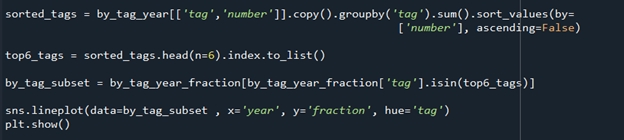
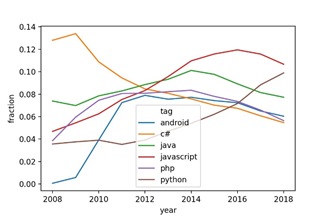
Figure 3 Top six tags over time
Final Thoughts
In this blog, we explored some trends regarding the rise and fall of the programming languages. We also discovered few of the most popular languages or/and technologies used over 2008 till 2018. We were able to do seamless integration and data import using GridDB, which allowed us to store large amounts of data in a highly efficient and flexible way.
PS. All related files for the tutorial are available at https://raw.githubusercontent.com/ismailvohra/riseFallProgrammingLanguageGridDb