A dashboard is a comprehensive snapshot of your company’s performance. Because the nature of a dashboard is dynamic, one can click on any area of performance and ‘drill-down’ to see more details. The function of a dashboard is to provide reliable results by aggregating and extracting value from all the data collected in your data warehouse, otherwise known as your key performance indicators (KPIs). This way, it becomes easy for users to understand data, even non-technical users. We will use streamlit and GridDB to help us built the dashboard webapp. Streamlit lets you turn data scripts into sharable web apps in minutes.
As a first step, we will create a simple we scraper of S&P500 data. After retrieving the ticker symbols, the resulting list will be used to fetch the stock price data from the yfinance library in Python. In the end, we will create the web app combining both functions.
The outline of the tutorial is as follows:
- Prerequisites and Environment setup
- Dataset overview
- Importing required libraries
- Loading datasets
- Building the dashboard
- Conclusion
Prerequisites and Environment setup
For this project, we will need to install Streamlit and have GridDB installed along with its Python Client. The following packages need to be installed before you continue with the tutorial –
-
Pandas
-
matplotlib
-
griddb_python
-
Streamlit
-
seaborn
-
numpy
-
yfinance
You can install these packages in Conda’s virtual environment using conda install package-name. In case you are using Python directly via terminal/command prompt, pip install package-name will do the work.
GridDB installation
While loading the dataset, this tutorial will cover two methods – Using GridDB as well as Using Pandas. To access GridDB using Python, the following packages also need to be installed beforehand:
- GridDB C-client
- SWIG (Simplified Wrapper and Interface Generator)
- GridDB Python Client
Dataset Overview
The S&P 500 stock market index is maintained by S&P Dow Jones Indices. It comprises 504 common stocks which are issued by 500 large-cap companies traded on American stock exchanges. Although called the S&P 500, the index contains 505 stocks because it includes two share classes of stock from 5 of its component companies.
The data used are available using these two links (https://en.wikipedia.org/wiki/List_of_S%26P_500_companies) and (https://pypi.org/project/yfinance/).
Importing Required Libraries and the datasets
import griddb_python as griddb
import streamlit as st
import pandas as pd
import base64
import matplotlib.pyplot as plt
import seaborn as sns
import numpy as np
import yfinance as yf
st.set_option('deprecation.showPyplotGlobalUse', False)
2022-04-25 14:04:27.637 INFO numexpr.utils: Note: NumExpr detected 12 cores but "NUMEXPR_MAX_THREADS" not set, so enforcing safe limit of 8.
2022-04-25 14:04:27.663 INFO numexpr.utils: NumExpr defaulting to 8 threads.
Loading the Dataset
We should now load the data into the GridDB server. Although it is possible to read the data directly from the CSV file, we can take advantage of GridDB’s hybrid in-memory architecture to increase the speed of the application. We will also be able to load the necessary data into dataframes, boosting the performance of our queries.
Using GridDB
Toshiba GridDB™ is a highly scalable NoSQL database best suited for IoT and Big Data. The foundation of GridDB’s principles is based upon offering a versatile data store that is optimized for IoT, provides high scalability, tuned for high performance, and ensures high reliability.
To store large amounts of data, a CSV file can be cumbersome. GridDB serves as a perfect alternative as it in open-source and a highly scalable database. GridDB is a scalable, in-memory, No SQL database which makes it easier for you to store large amounts of data. If you are new to GridDB, a tutorial on reading and writing to GridDB can be useful.
To start, we will load all of the data (in CSV form) into our GridDB server. Though we could easily load the data directly from CSV into dataframes objects, loading them into our database first will significantly increase the speed of the application because of GridDB’s hybrid in-memory architecture.
factory = griddb.StoreFactory.get_instance()

# Initialize the GridDB container (enter your database credentials)
try:
    gridstore = factory.get_store(host=host_name, port=your_port,
            cluster_name=cluster_name, username=admin,
            password=admin)

    info = griddb.ContainerInfo("S&P500",
                    [["Symbol", griddb.Type.STRING],["Security", griddb.Type.STRING],[" SEC filings", griddb.Type.STRING],
                     ["GICS Sector", griddb.Type.STRING],["GICS Sub-Industry", griddb.Type.STRING],
                     ["Headquarters Location", griddb.Type.STRING],["Date first added", griddb.Type.TIMESTAMP]
                     ["CIK",griddb.Type.INTEGER]], ["Founded",griddb.Type.INTEGER]],
                    griddb.ContainerType.COLLECTION, True)
    cont = gridstore.put_container(info)


sql_statement = ('SELECT * FROM S&P500')
dataset = pd.read_sql_query(sql_statement, cont)
Note that the cont variable has the container information where our data is stored. Replace the S&P500 with the name of your container. More info can be found in this tutorial reading and writing to GridDB.
When it comes to IoT and Big Data use cases, GridDB clearly stands out among other databases in the Relational and NoSQL space. Overall, GridDB offers multiple reliability features for mission-critical applications that require high availability and data retention.
Using pandas to read_html
In Python you need to give access to a file by opening it. You can do it by using the open() function. Open returns a file object, which has methods and attributes for getting information about and manipulating the opened file. After loading the data we download the file in csv format.
# @st.cache
def load_data():
    url = 'https://en.wikipedia.org/wiki/List_of_S%26P_500_companies'
    html = pd.read_html(url, header = 0)
    df = html[0]
    return df

df = load_data()
sector = df.groupby('GICS Sector')
# Sidebar - Sector selection
sorted_sector_unique = sorted( df['GICS Sector'].unique() )
selected_sector = st.sidebar.multiselect('Sector', sorted_sector_unique, sorted_sector_unique)
# Filtering data
df_selected_sector = df[ (df['GICS Sector'].isin(selected_sector)) ]# Download S&P500 data
# https://discuss.streamlit.io/t/how-to-download-file-in-streamlit/1806
def filedownload(df):
csv = df.to_csv(index=False)
b64 = base64.b64encode(csv.encode()).decode() # strings <-> bytes conversions
href = f'<a href="data:file/csv;base64,{b64}" download="SP500.csv">Download CSV File</a>'
return href
st.markdown(filedownload(df_selected_sector), unsafe_allow_html=True)DeltaGenerator(_root_container=0, _provided_cursor=None, _parent=None, _block_type=None, _form_data=None)
# https://pypi.org/project/yfinance/

data = yf.download(
        tickers = list(df_selected_sector[:10].Symbol),
        period = "ytd",
        interval = "1d",
        group_by = 'ticker',
        auto_adjust = True,
        prepost = True,
        threads = True,
        proxy = None
    )
[*********************100%***********************] 10 of 10 completed
df.head()| Symbol | Security | SEC filings | GICS Sector | GICS Sub-Industry | Headquarters Location | Date first added | CIK | Founded | |
|---|---|---|---|---|---|---|---|---|---|
| 0 | MMM | 3M | reports | Industrials | Industrial Conglomerates | Saint Paul, Minnesota | 1976-08-09 | 66740 | 1902 |
| 1 | AOS | A. O. Smith | reports | Industrials | Building Products | Milwaukee, Wisconsin | 2017-07-26 | 91142 | 1916 |
| 2 | ABT | Abbott | reports | Health Care | Health Care Equipment | North Chicago, Illinois | 1964-03-31 | 1800 | 1888 |
| 3 | ABBV | AbbVie | reports | Health Care | Pharmaceuticals | North Chicago, Illinois | 2012-12-31 | 1551152 | 2013 (1888) |
| 4 | ABMD | Abiomed | reports | Health Care | Health Care Equipment | Danvers, Massachusetts | 2018-05-31 | 815094 | 1981 |
Once the dataset is loaded, let us now explore the dataset. We’ll print the first 5 rows of this dataset using head() function.
data.head()Building the dashboard
You can add text to your app in a number of ways with Streamlit. Here’s an example. In our dashboard, we will also add small paragraphs and write-ups using Markdown
# Dashboard Title and paragraphs
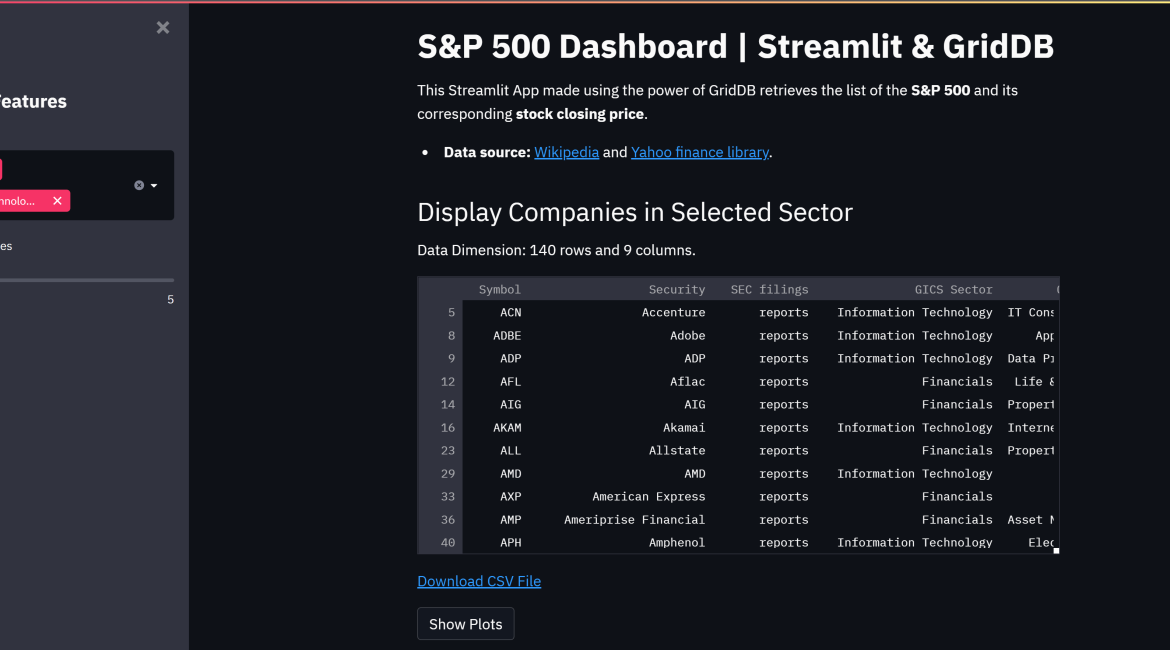
st.title('S&P 500 Dashboard | Streamlit & GridDB')
st.markdown("""
This Streamlit App made using the power of GridDB retrieves the list of the **S&P 500** and its corresponding **stock closing price**.
* **Data source:** [Wikipedia](https://en.wikipedia.org/wiki/List_of_S%26P_500_companies) and [Yahoo finance library] (https://pypi.org/project/yfinance/).
""")For dropdown we use st.selectbox to choose from a series. You can write in the options you want, or pass through an array or data frame column.
st.header('Display Companies in Selected Sector')
st.write('Data Dimension: ' + str(df_selected_sector.shape[0]) + ' rows and ' + str(df_selected_sector.shape[1]) + ' columns.')
st.dataframe(df_selected_sector)
There are several popular data charting libraries supported by Streamlit, such as Matplotlib, Altair, and Plotly. For our dashboard, we will use Matplotlib.
There is also a sidebar that gives streamlit a cleaner look and keeps your app to the left of the page, while all widgets can be moved there. Let’s create a widget for the state sidebar and a dropdown filter using st.sidebar.
Below is the code for lineplots necessary to give us a good view of the stocks closing price data.
# Plot Closing Price of Query Symbol
def price_plot(symbol):
  df = pd.DataFrame(data[symbol].Close)
  df['Date'] = df.index
  plt.fill_between(df.Date, df.Close, color='red', alpha=0.3)
  plt.plot(df.Date, df.Close, color='red', alpha=0.8 )
  plt.xticks(rotation=45)
  plt.title(symbol, fontweight='normal')
  plt.xlabel('Date', fontweight='normal')
  plt.ylabel('Closing Price', fontweight='normal')
  return st.pyplot()

num_company = st.sidebar.slider('Number of Companies', 1, 5)

if st.button('Show Plots'):
    st.header('Stock Closing Price')
    for i in list(df_selected_sector.Symbol)[:num_company]:
        price_plot(i)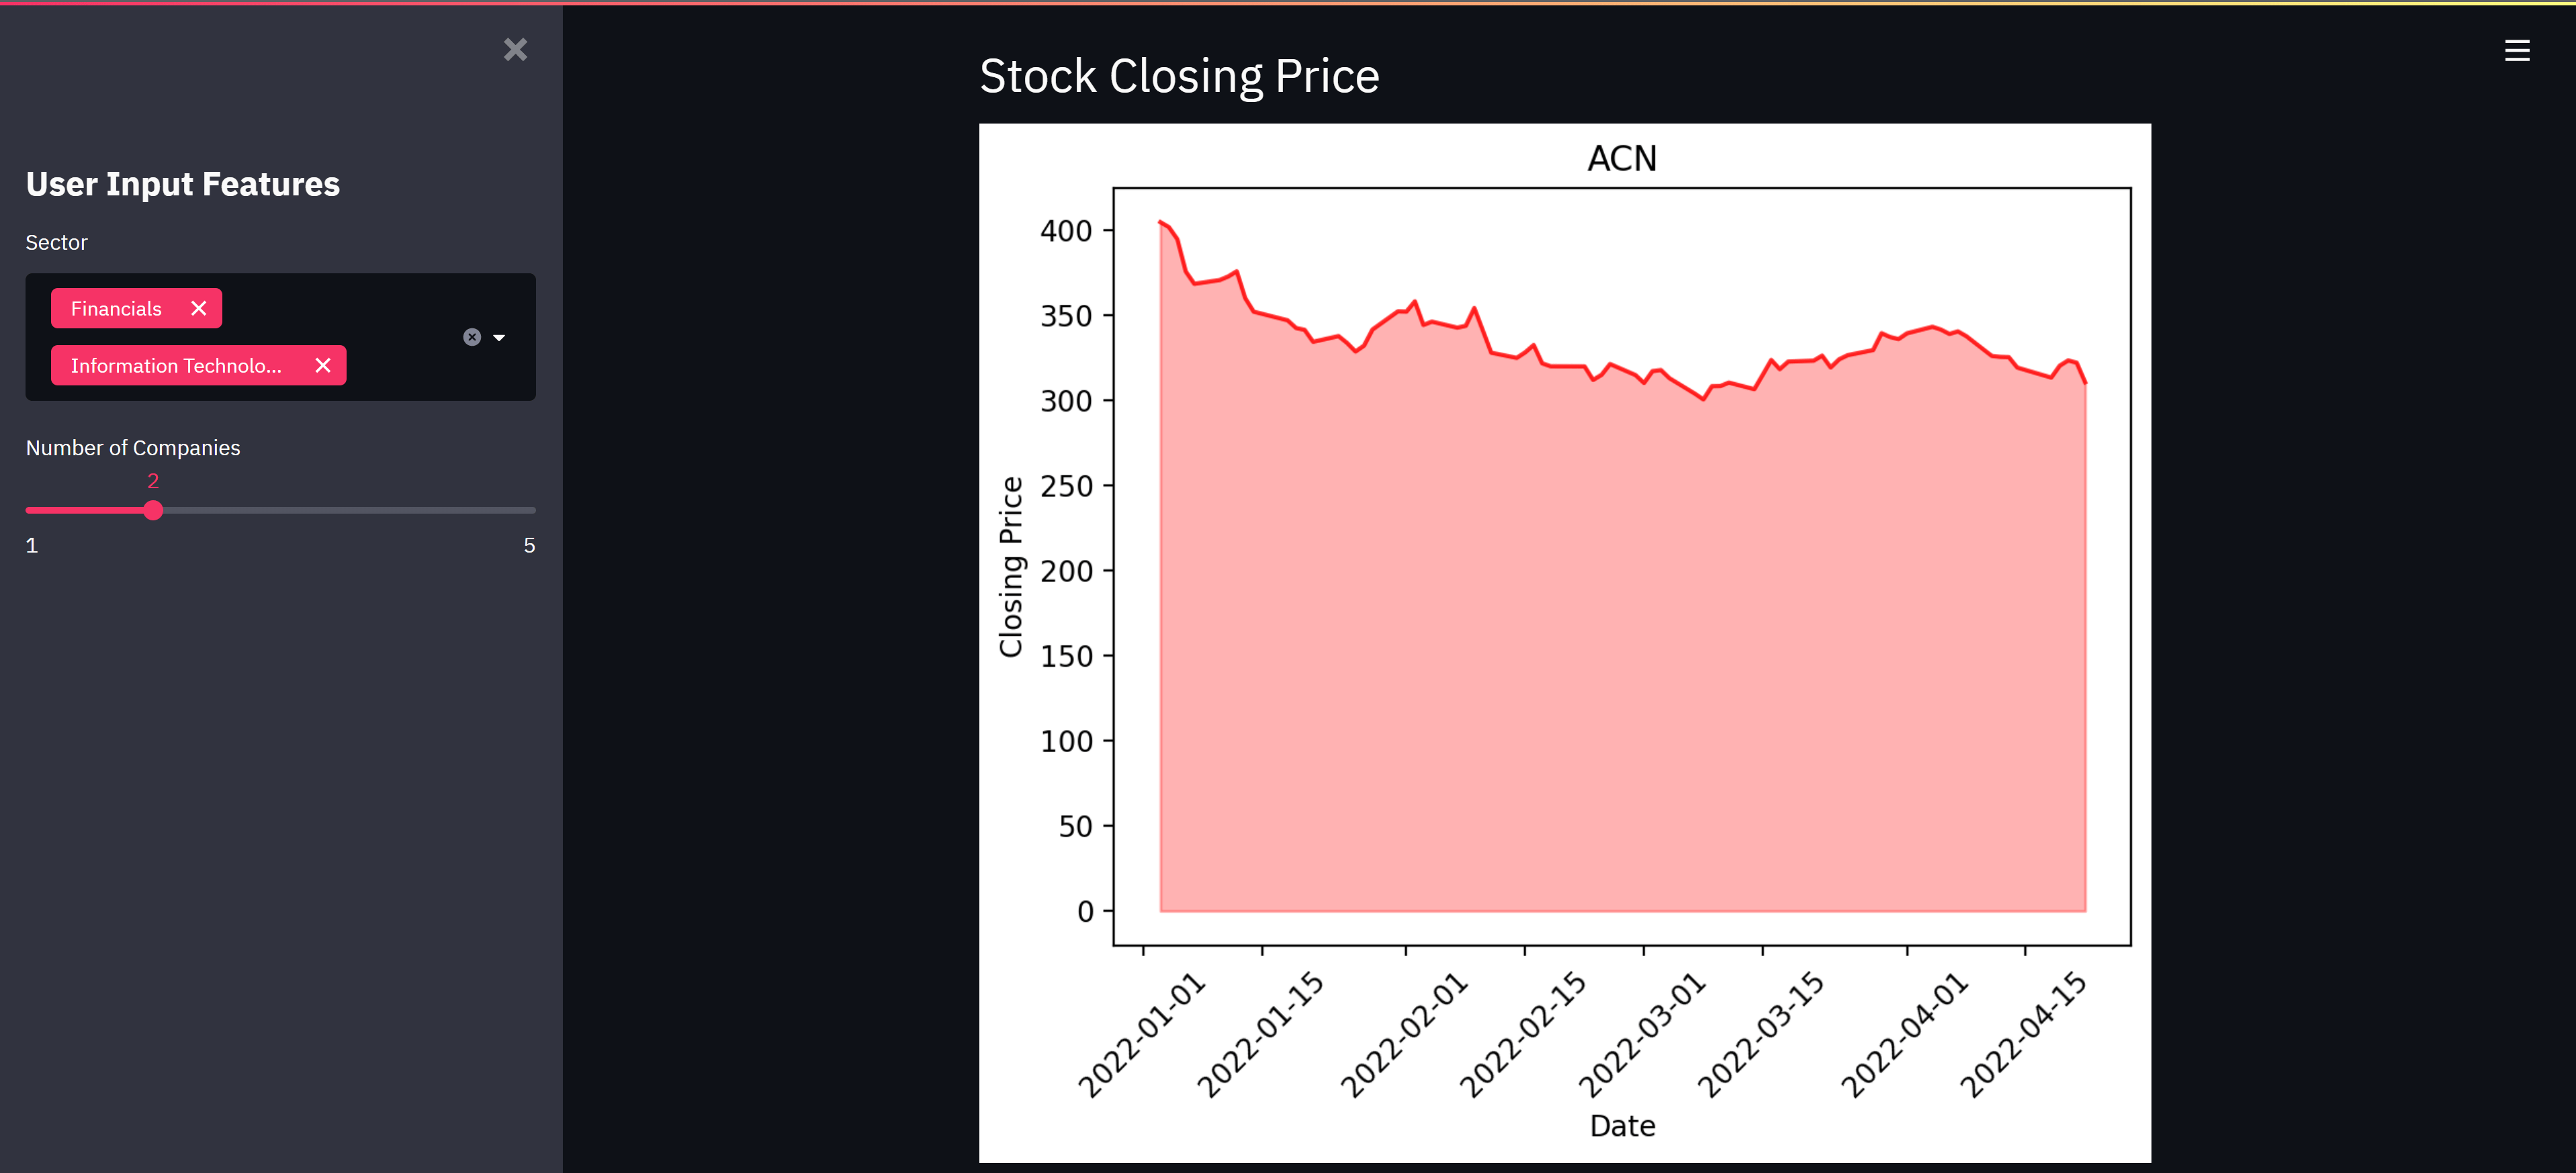
Now that we are finished with the code. Open a terminal and navigate to the path where main.py is located and start the streamlit web server by typing this in command line.
streamlit run main.py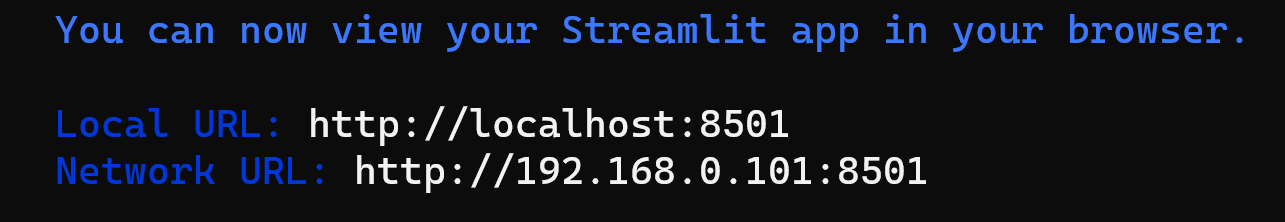
By default it will be running on port 8501. Open your browser and and hit this url http://localhost:8501 to see your dashboard in the browser
Conclusion
In this tutorial, we’ve built an amazing dashboard using the power of GridDB and streamlit. We examined two ways to import our data, using (1) GridDB and (2) pandas read_csv. For large datasets, GridDB provides an excellent alternative to import data in your notebook as it is open-source and highly scalable.