
In this blog, we’ll cover the usage of the GridDB Output plugin for Logstash which enables us to write syslog (and more) log records to a GridDB Cloud container. Logstash is a server-side log file parser that allows you to store metrics in a database of your choosing. It is often used alongside Elasticsearch (to stash the data) and Kibana (to visualize the data) as part of the ELK-stack. Replacing Elasticsearch with GridDB leverages GridDB’s high performance to lower operational costs of your log monitoring infrastructure.
To demonstrate the GridDB Logstash plugin, we’ll install and configure Logstash with some filters to push unsuccessful SSH login messages generated by the local server’s Syslog daemon that Logstash will then store in GridDB Cloud. Finally, using GridDB Cloud again, we’ll build a query for a simple SSH intrusion detection system.
Installation
The GridDB Logstash plugin requires CentOS 7.9 (x64), Ruby v2.4+, Logstash 7.15+
First we install RVM & Ruby:
$ curl -sSL https://rvm.io/mpapis.asc | gpg --import -
$ curl -sSL https://rvm.io/pkuczynski.asc | gpg --import -
$ curl -L get.rvm.io | bash -s stable
$ source ~/.rvm/scripts/rvm
$ rvm reload
$ rvm install 2.5.3
Now we setup the Logstash YUM Repo and install Logstash:
$ cat << EOF | tee /etc/yum.repos.d/logstash.repo
[logstash-7.x]
name=Elastic repository for 7.x packages
baseurl=https://artifacts.elastic.co/packages/7.x/yum
gpgcheck=1
gpgkey=https://artifacts.elastic.co/GPG-KEY-elasticsearch
enabled=1
autorefresh=1
type=rpm-md
EOF

$ yum install logstash
Now we’re ready to build and install the GridDB Logstash plugin:
$ cd /path/to/logstash-output-griddb
$ gem build logstash-output-griddb.gemspec
$ /usr/share/logstash/bin/logstash-plugin install logstash-output-griddb-1.0.0.gem
Now we’re ready to start using Logstash with the GridDB output plugin.
Basic Usage
First, we need to create a config file /etc/logstash/mylogstash.conf with both input and output sections. In the input section, we configure Logstash to simply read /var/log/secure and parse it as a syslog output. This will let us track all logins.
input { file { path => “/var/log/secure” type => “syslog” } }
output { griddb { host => “https://cloud1.griddb.com/trial1234” cluster => “gs_clustertrial1234” database => “public” container => “secure_syslog”
username => “logstash” password => “
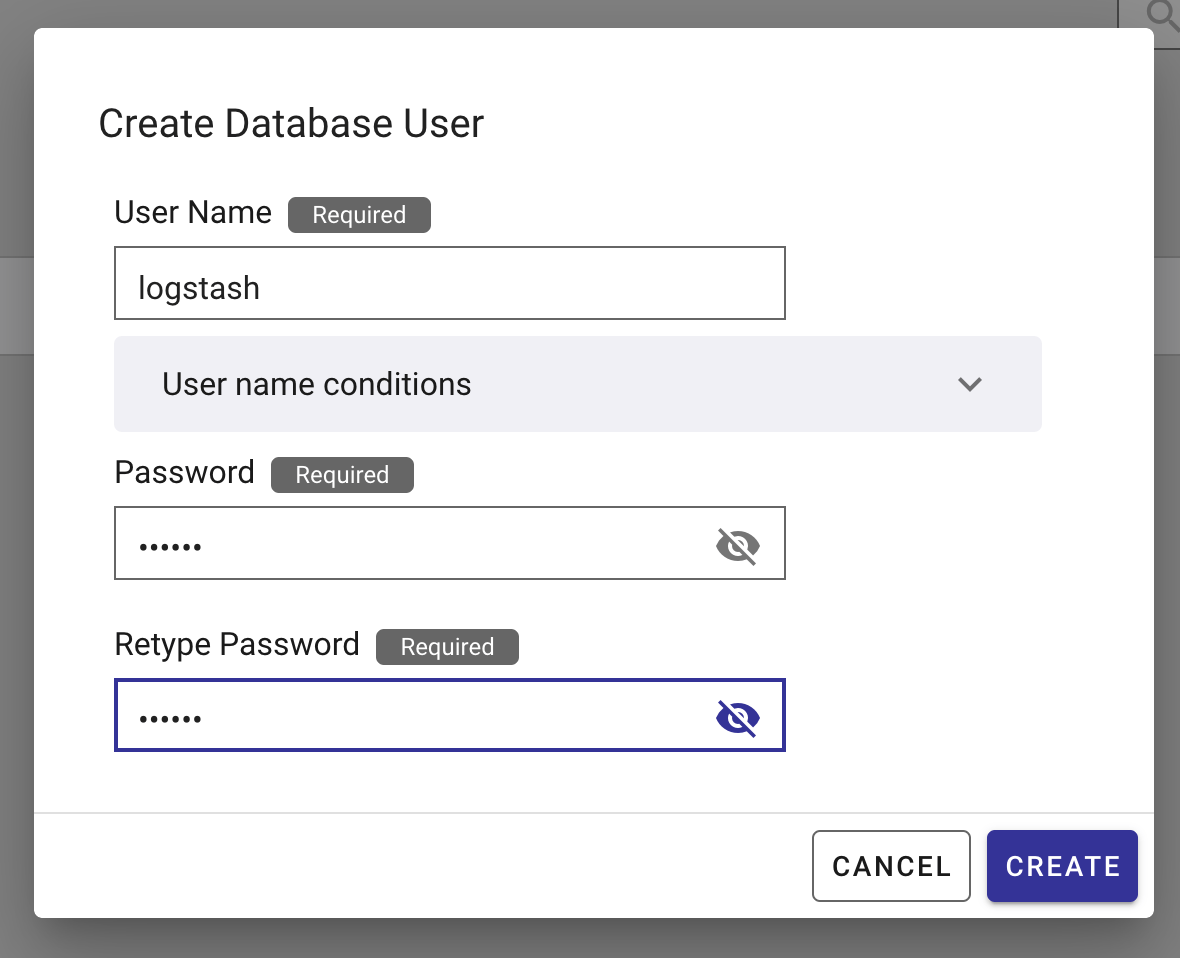
Create a Logstash user in the GridDB Cloud portal:
Now start Logstash with your config file: $ sudo /usr/share/logstash/bin/logstash -f /etc/logstash/mylogstash.conf –path.settings /etc/logstash
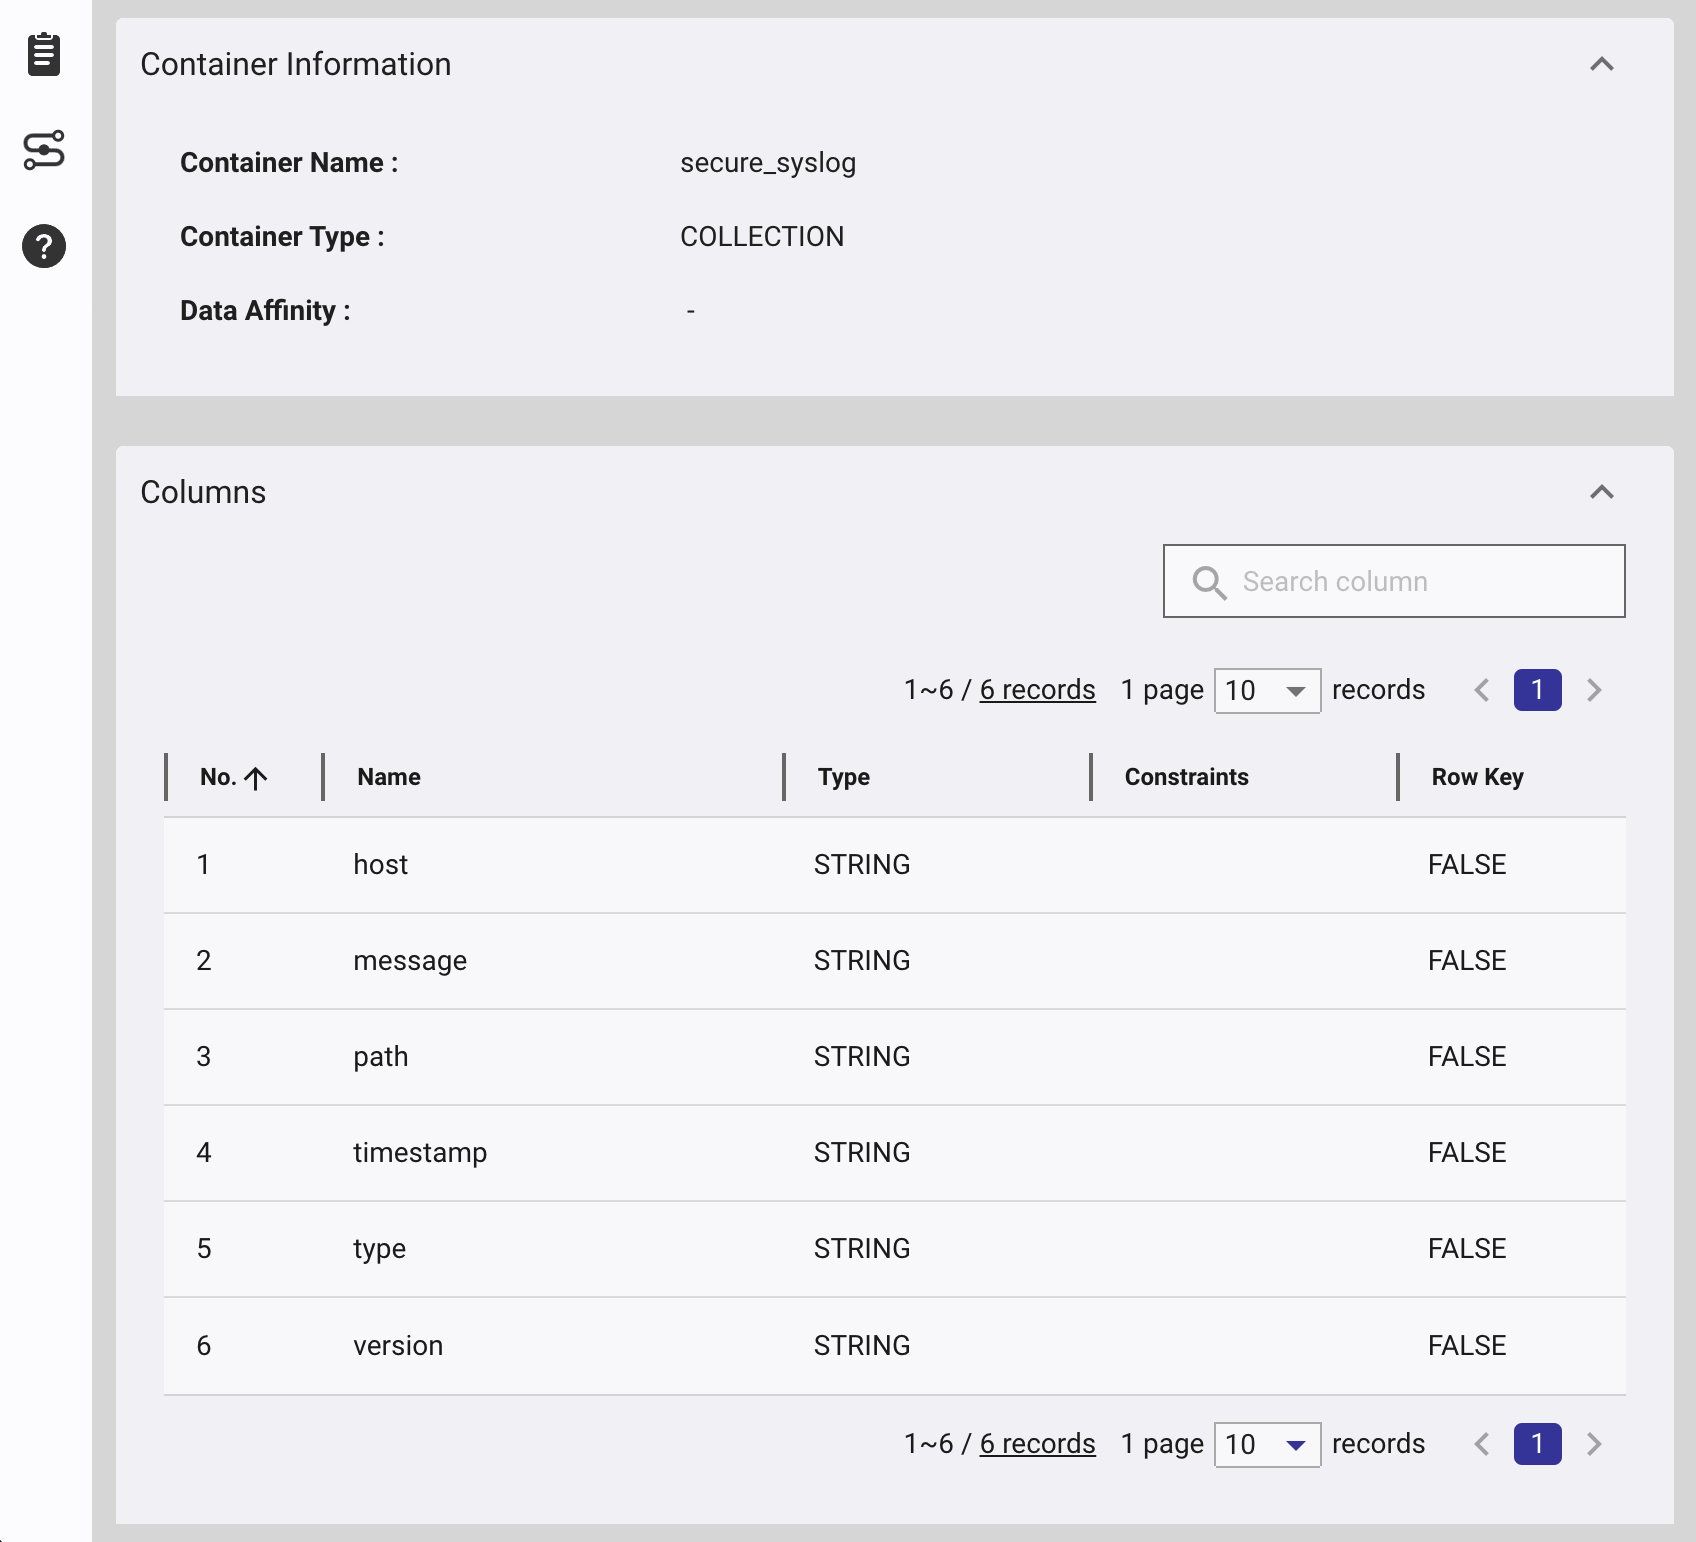
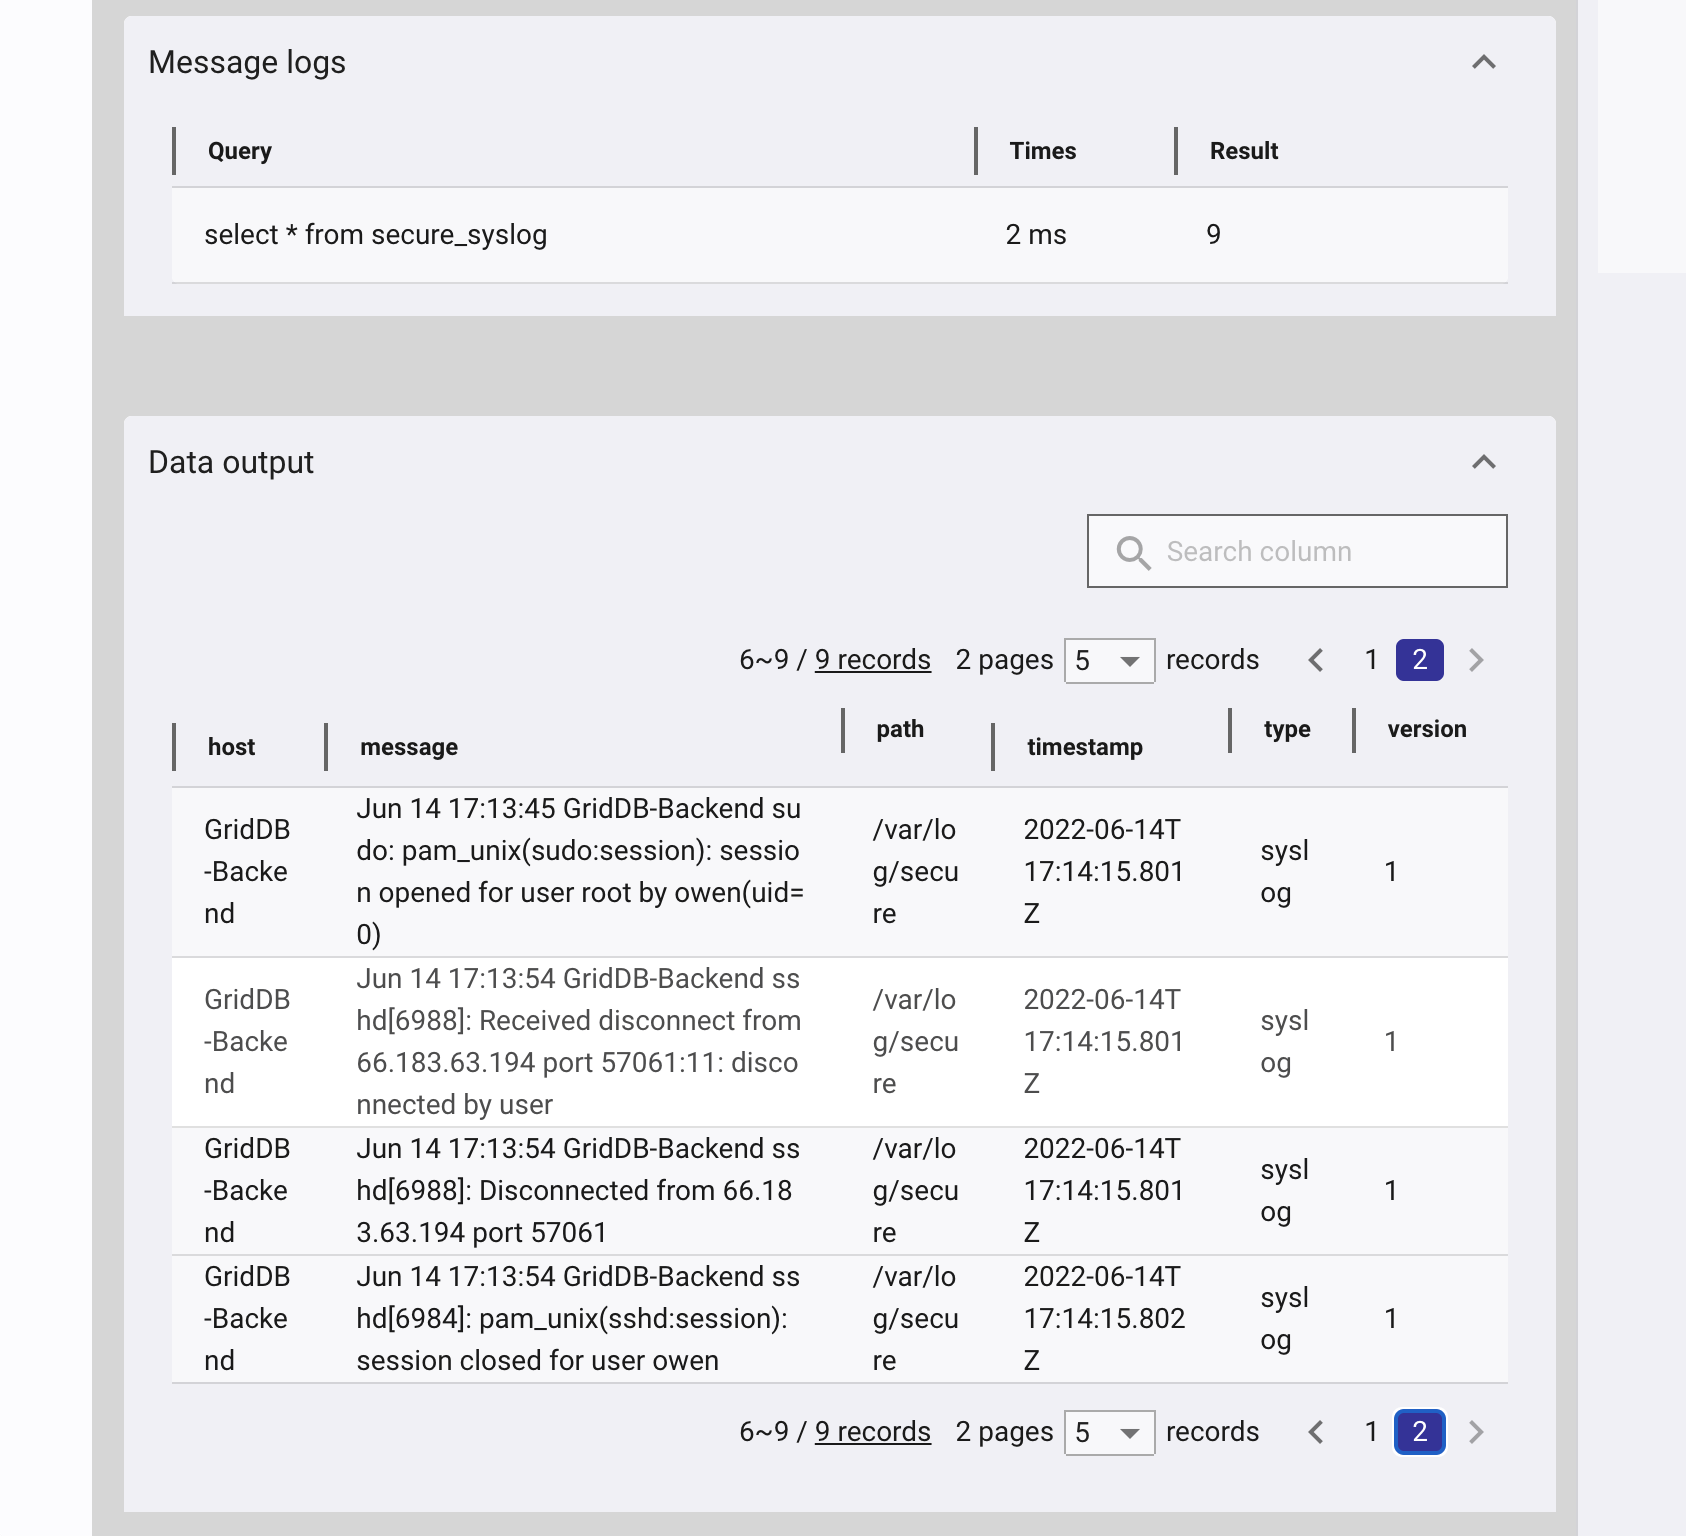
Now when a user logins or uses sudo, the secure log messages will be written to GridDB.
Filtering, Grok and Mutate
Secure log has more than just SSHD messages, we can filter out non-SSH messages by adding the following filter:
filter {
    if ([message] !~ "sshd") {
        drop { }
    }
}
What if you only want to track to unsuccessful logins? When a login fails, a “Connection closed by $remotehost port $port [preauth]” entry is added to secure log. First we filter out all messages that do not have contain “Connection closed by” and “[preauth]”.
    if ([message] !~ "[preauth]") {
        drop { }
    }
    if ([message] !~ "Connection closed by") {
        drop { }
    }
Then we can grok for the log entry to get the remote host which is added to the remhost field. This block also gets to the filter block. Grok is extremely powerful, it is worth checking out its capabilities here.
    grok {
        match => { "message" => "closed by %{IPORHOST:remhost} port "  }
    }
Now we can use mutate to remove unnecessary fields. Mutate can alter fields in many ways documented here.
    mutate {
        remove_field => ["path", "type", "version"]
    }
Now we can use aggregation functions in the query to count the number of unsuccessful logins from different remote hosts.
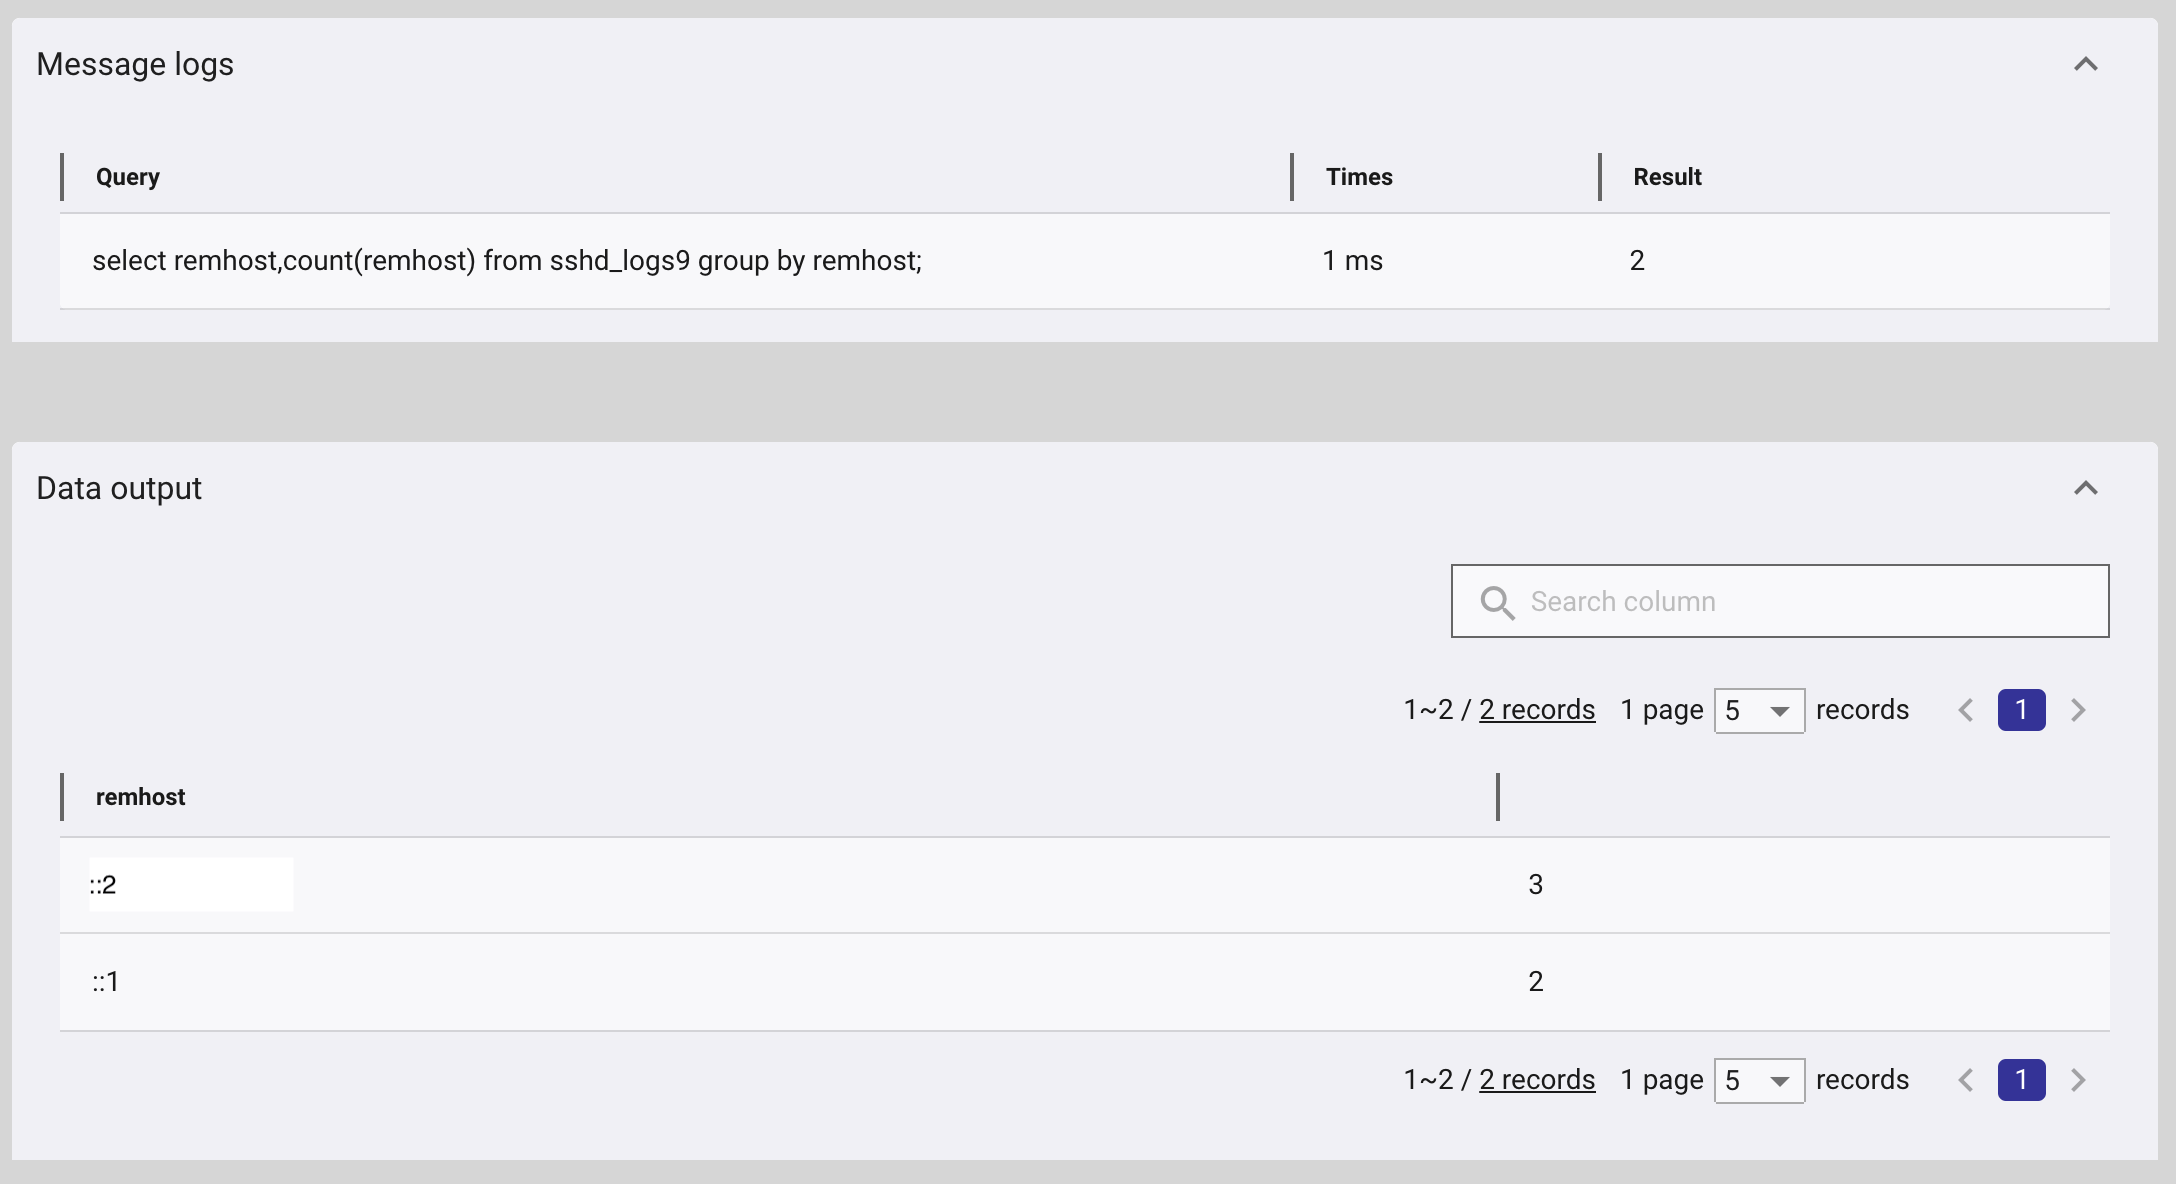
Taking the output of that query, we can see the remote hosts with the most number of unsuccessful logins. Rules can be added to the firewall to prevent these attackers from even connecting to your SSH server.