Introduction
Data visualization is the process of representing data or information in a chart, graph, or other visual formats. It communicates the relationships between various data variables using images.
A visual summary of data makes it easy for anyone to identify trends and patterns than searching through tens, hundreds, thousands, or even millions of rows in a spreadsheet. That’s how the human brain works.
The goal of data analysis is to extract insights from data and data becomes more valuable when it is visualized. Although it is possible for data analysts to extract insights from data without visualizing it, it will be difficult for them to communicate the trends and patterns without visualization.
In this article, we will be discussing how to visualize data in Java using JFreeChart and GridDB.
Understanding JFreeChart
JFreeChart is a Java library for creating charts. It allows its users to create a wide variety of both interactive and non-interactive charts. With JFreeChart, you can create bar charts, line charts, scatter charts, area charts, gantt charts, pie charts, and specialized charts like bubble chart and wind chart.
JFreeChart is a customizable library. It makes it easy for you to change the paints and colors of chart items, styles of markers or lines, legends, and more. JFreeChart automatically creates the legends and axis scales. Charts created with JFreeChart can zoom in with the mouse. JFreeChart allows you to save your charts in different formats including SVG, JPEG, PDF, and PNG.
Using JFreeChart to Visualize Data
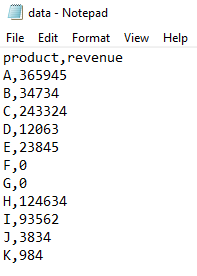
Now that you are familiar with JFreeChart, let us start to use it for data visualization. We will be creating a Histogram that visualizes the amount of revenue generated from the sale of different products. The data has been stored in a CSV (Comma Separated Values) format as shown below:
We will first move the data from the CSV file (data.csv) into GridDB and then pull it from GridDB for visualization.
Add JFreeChart to your Project
You will need JFreeChart to visualize your data. You can download it from the following URL
https://www.jfree.org/jfreechart/download/
Download the latest version of JFreeChart. Once the download is complete, extract the downloaded file.
We need to add two jar files to the project.
In Eclipse, follow the steps given below:
Step 1: Right click the name of the project on the Project Explorer and select “Properties..” from the pop up menu.
Step 2: Do the following on the Properties dialog:
-
Select the Java Build path from the list given on the left
-
Click the “Libraries” tab
-
Click the “Add external JARS…” button and navigate to the location where you’ve extracted the JFreeChart file. Open its “lib” folder. In my case, I find in the following directory:
jfreechart-1.0.19jfreechart-1.0.19lib -
Select the files “jcommon- …” and “jfreechart- …” and click the “Open” button.
Step 3: Click “OK” to close the dialog box.
You will have added the two jar files of the JFreeChart library to your Java project.
Note that you can also use these jar files from the terminal of your operating system. You will learn this later.
Import the Packages
Now that you’ve added the files to your project, let’s import some packages to the project:
import org.jfree.chart.*;
import org.jfree.data.*;
import org.jfree.data.xy.*;
import org.jfree.chart.plot.*;
import org.jfree.data.category.*;
import org.jfree.chart.renderer.category.*;
import org.jfree.data.general.DefaultPieDataset;
import java.awt.*;
Next, I will be showing you how to establish a connection to GridDB from Java and write the .csv data into it.
Connect to the Database
We should now establish a connection to the GridDB database. First, let’s import another set of packages to help us work with the GridDB:
import com.toshiba.mwcloud.gs.Collection;
import com.toshiba.mwcloud.gs.GSException;
import com.toshiba.mwcloud.gs.GridStore;
import com.toshiba.mwcloud.gs.GridStoreFactory;
import com.toshiba.mwcloud.gs.Query;
import com.toshiba.mwcloud.gs.RowKey;
import com.toshiba.mwcloud.gs.RowSet;
import java.util.Properties;
import java.util.Collection;
Next, let’s define the container “Sales” as a static Java class:
 static class Sales {
    @RowKey char product;
    int revenue;
}
The container Sales has two columns namely product and revenue. Each of these has been represented in the above static class in the form of variables.
It’s now time to establish a connection to GridDB. You should create a Properties instance and specify the details of your GridDB installation:
Properties props = new Properties();
        props.setProperty("notificationAddress", "239.0.0.1");
        props.setProperty("notificationPort", "31999");
        props.setProperty("clusterName", "defaultCluster");
        props.setProperty("user", "admin");
        props.setProperty("password", "admin");
        GridStore store = GridStoreFactory.getInstance().getGridStore(props);
In the above code, I have specified the details of my GridDB installation, including the cluster name, username, and password. You can change them to reflect the details of your GridDB installation.
To run a query against the database, we should first get the container, that is, the Sales container:. The following code will help us achieve this:
Collection<String, Sales> coll = store.putCollection("col01", Sales.class);An instance of the container has been created and given the name coll. Thus, anytime we need to access the container, we will be using the name coll.
Read the Data and Store it in GridDB
We should read our data from the “data.csv” file and store it in GridDB.
Use the following code:
File myfile = new File("data.csv");
                Scanner sc = new Scanner(myfile);
                String data = sc.next();

                while (sc.hasNext()){
                        String scData = sc.next();
                        String dataList[] = scData.split(",");
                        String product = dataList[0];
                        String revenue = dataList[1];


                        Sales sales = new Sales();

                        sales.product = product;
                        sales.revenue = Integer.parseInt(revenue);
                        coll.append(sales);
                 }
The code given above reads data from the “data.csv” file and creates a sales object. The code has then appended the “sales” object into the GridDB database. Note that we’ve set a comma (,) as the delimiter for the .csv dataset.
Retrieve Data from GridDB
It’s time to pull the data from GridDB so as to visualize it. Use the following code:
Query<sales> query = coll.query("select *");
                RowSet</sales><sales> rs = query.fetch(false);
                while (rs.hasNext()) {
                RowSet res = query.fetch();
                }</sales>
We have used the Select statement to fetch all the data from the GridDB container. Next, we will be generating a histogram from this data.
Visualize the Data
We can now use JFreeChart to create a historgram that visualizes our data. It comes with a function named createBarChart() that we can use to create a histogram. The name of the dataset to be visualized should be passed to the function as a parameter as shown below:
JFreeChart histogram = ChartFactory.createBarChart
  ("GridDB and JFreeChart","Product", "Revenue", res,
   PlotOrientation.VERTICAL, false,true, false);
   histogram.setBackgroundPaint(Color.white);
  histogram.getTitle().setPaint(Color.red);
  CategoryPlot cp = histogram.getCategoryPlot();
  cp.setRangeGridlinePaint(Color.blue);
  ChartFrame frame=new ChartFrame("Bar Chart",histogram);
  frame.setVisible(true);
  frame.setSize(600,400);
We have specified the names to be given to both the X and the Y axis of the chart as well as the title. The dataset to be used to plot the histogram is res. We have also added colors to the chart.
Compile and Execute the Code
First, login as the gsadm user. Move your .java file and the .jar files for JFreeChart to the bin folder of your GridDB located in the following path:
/griddb_4.6.0-1_amd64/usr/griddb-4.6.0/bin
You can find the .jar files under the “lib” folder of JFreeChart.
Next, run the following command on your Linux terminal to set the path for the gridstore.jar file:
export CLASSPATH=$CLASSPATH:/home/osboxes/Downloads/griddb_4.6.0-1_amd64/usr/griddb-4.6.0/bin/gridstore.jar
Also, set the path for the .jar file for JFreeChart:
export CLASSPATH=$CLASSPATH:/home/osboxes/Downloads/griddb_4.6.0-1_amd64/usr/griddb-4.6.0/bin/jfreechart-1.0.1.jar
Next, navigate to the above directory and run the following command to compile your DataVisualization.java file:
javac -cp jfreechart-1.0.1.jar -cp jcommon-1.0.0.jar DataVisualization.java
Run the .class file that is generated by running the following command:
java DataVisualization
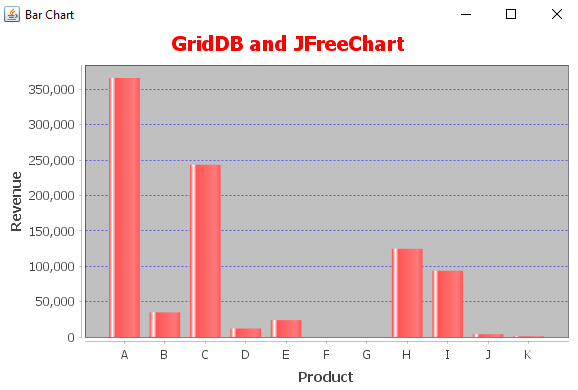
The code should generate the following chart:
Congratulations!
That’s how to visualize data in Java using JFreeChart and GridDB.