In this article, we will be discussing connecting GridDB with zabbix. If you are unfamiliar with Zabbix, it is described as “a software that monitors numerous parameters of a network and the health and integrity of servers, virtual machines, applications, services, databases, websites, the cloud and more.” In our case, we will plan to connect GridDB to Zabbix and monitor the health and integrity of the running GridDB database.
So, for this article, we will walk through setting up Zabbix, setting up GridDB, and then how to monitor GridDB in Zabbix with an included template file. This template file will instruct our Zabbix server of how to connect to our running GridDB server and what sorts of things to monitor.
Prerequisites & Installation
As stated above, we will need to have the following:
- Zabbix
- GridDB
- GridDB Web API
A copy of the template file: https://griddb.net/en/download/29709/
Installing Zabbix
To install Zabbix, you can follow the instructions here: https://www.zabbix.com/download?zabbix=6.4&os_distribution=ubuntu&os_version=22.04&components=server_frontend_agent&db=mysql&ws=apache. The instructions here are very straight forward, so there is not much I can add to help you along. The only thing I will say is that make sure you set a password during the mysql portion of the installation process; don’t just simply copy and paste the lines and set your password to “password” (as I did).
Another note is that I already had port 80 being used on my ubuntu machine so I needed to edit my apache2 config to change the port. If your port 80 is free, then you will be fine and once you are done following the instructions on the web page, you can navigate to the running Zabbix frontend (http://[host ip:port]/zabbix).
Installing GridDB
You can install GridDB using the docs here: https://docs.griddb.net/gettingstarted/using-apt/. Once your GridDB is installed, we can move on to the next portion.
Connecting GridDB to Zabbix
Now that we have our software ready to go, let’s actually walk through the process of uploading our (included) template file to monitor our GridDB server with Zabbix. For reference, a lot of the following information has been pulled from this document: https://www.toshiba-sol.co.jp/en/pro/griddb/docs-en/v5_2/GridDB_ZabbixTemplateGuide.html.
Zabbix Agent
First, we will need to set some config parameters; the GridDB template uses Active Check to retrieve the GridDB logs, so we will need to point our agent to the Zabbix server. Edit the zabbix_agentd.conf file (located in /etc/zabbix/) to add in the address of your Zabbix server and to add in the hostname. In my case, I simply kept it as localhost (127.0.0.1) and kept the hostname as the default value from the frontend “Zabbix server”. Please note that this is crucial to receive the gs_logs; if you do not insert the correct hostname, you will not receive the gs_log data.
Once you make your changes, restart the agent:
$ sudo systemctl restart zabbix-server zabbix-agentImporting the GridDB Template
Next we will need to connect to the Zabbix frontend; the default username and password are: Admin/zabbix. Once you have gone through the set up wizard, you will be greeted with the dashboard. Once in the dashboard, let’s try to import our GridDB Template xml file.
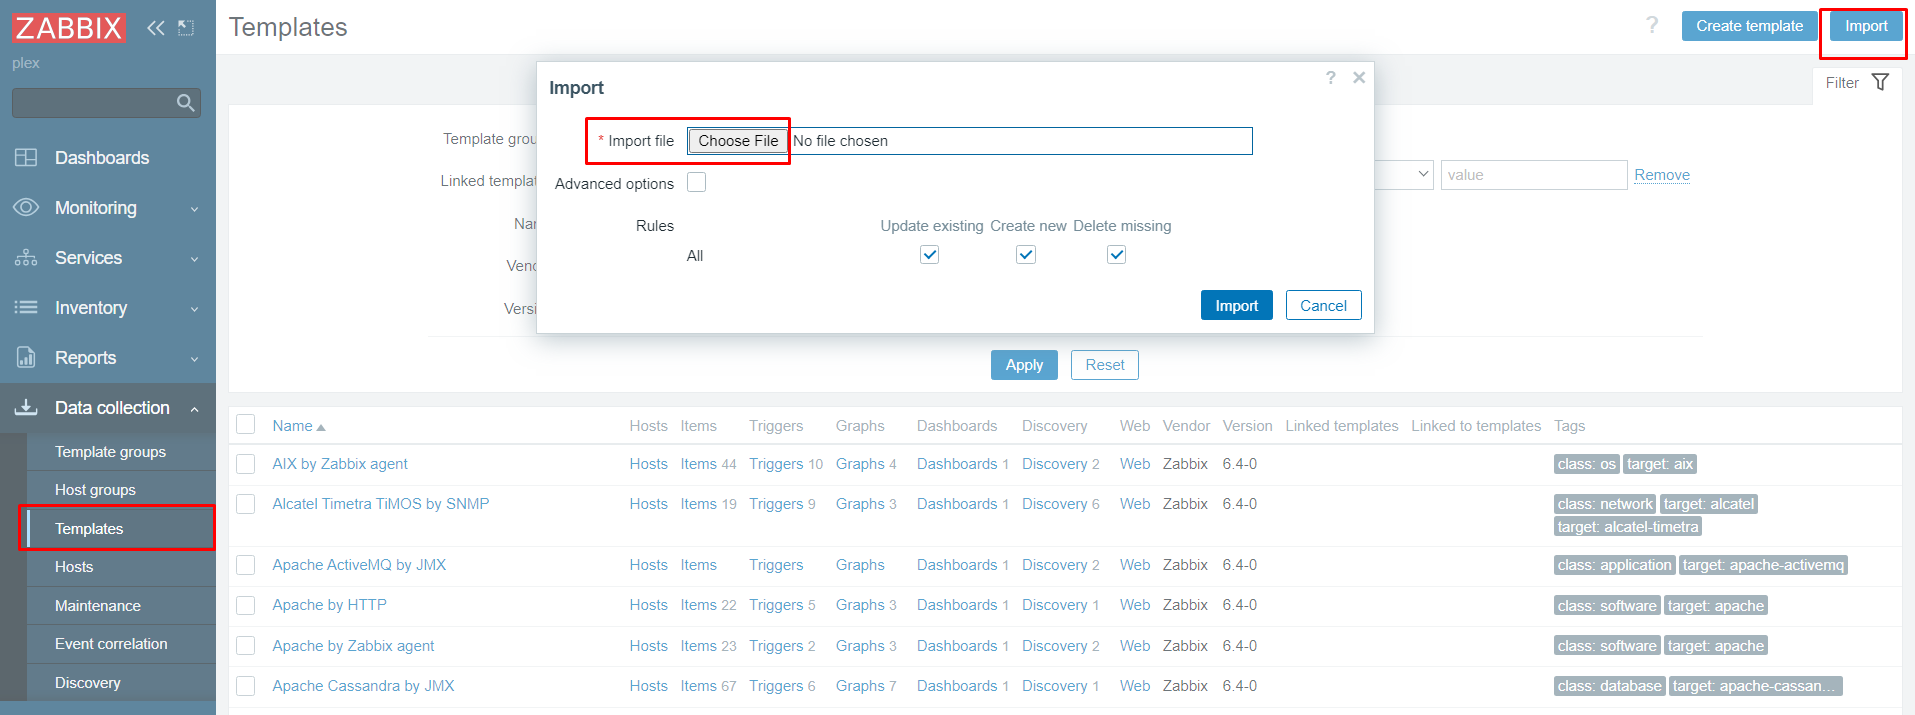
To do so, Data Collection –> Templates. On the top right corner, click import and select your GridDB template file and click import, confirm what’s on the screen, and click import again.
Also please note, that the template file provided here is solely for GridDB CE, meaning it does not contain information regarding GridDB node group (aka clustering) as it is solely for one node.
Again, you can download the template file here: https://griddb.net/en/download/29709/
Setting a Template to the Host
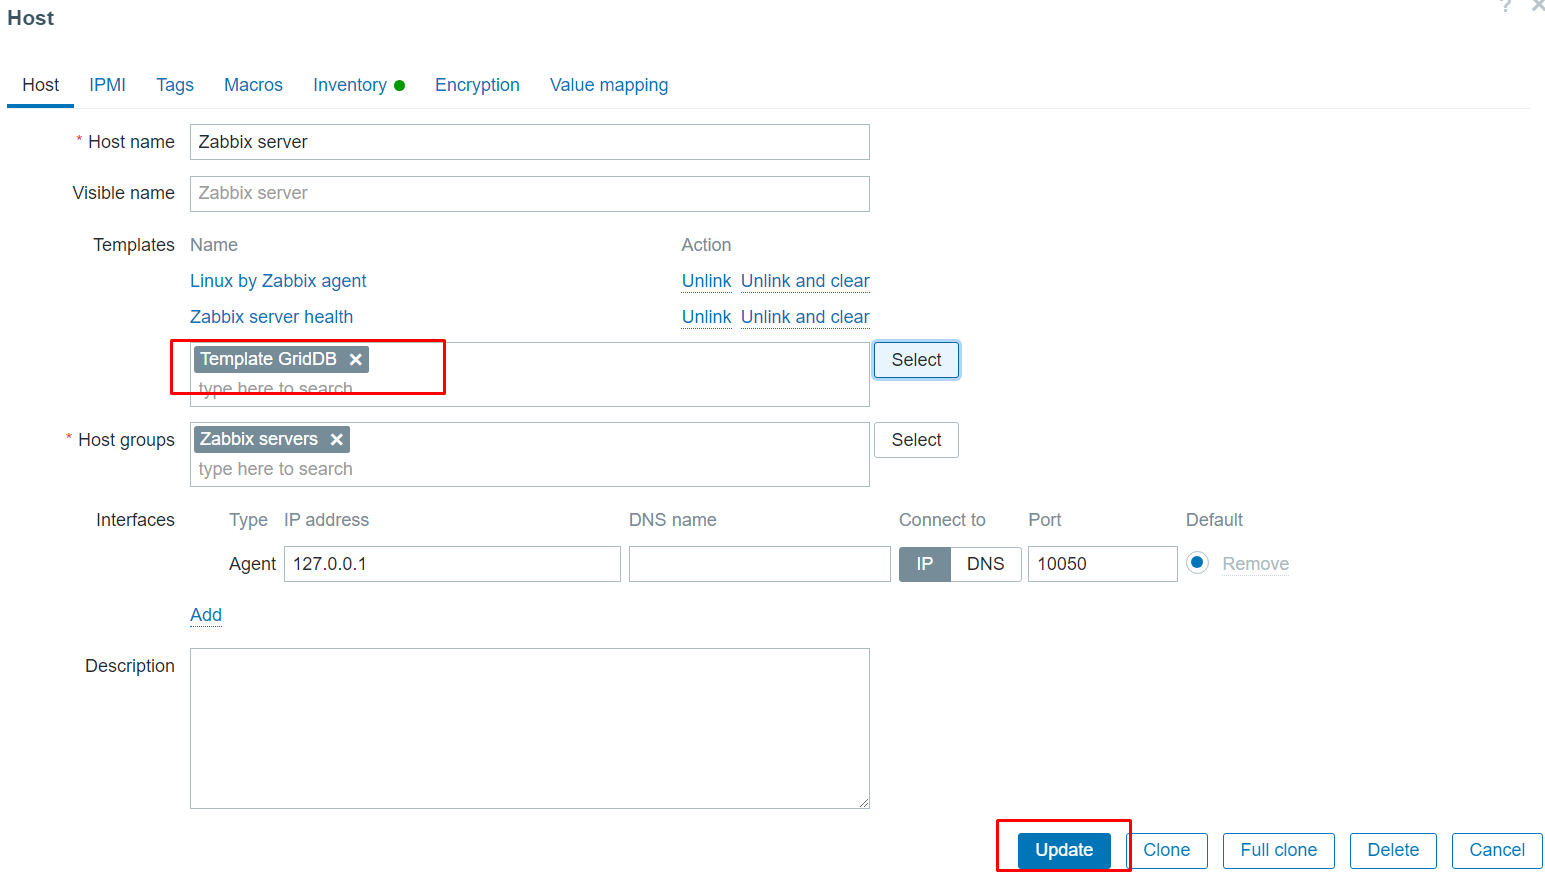
Next, go to Data Collection–> Hosts and click on your hostname –> “Zabbix server”. From there, in the template section, click select and find Template GridDB and add it and update it.
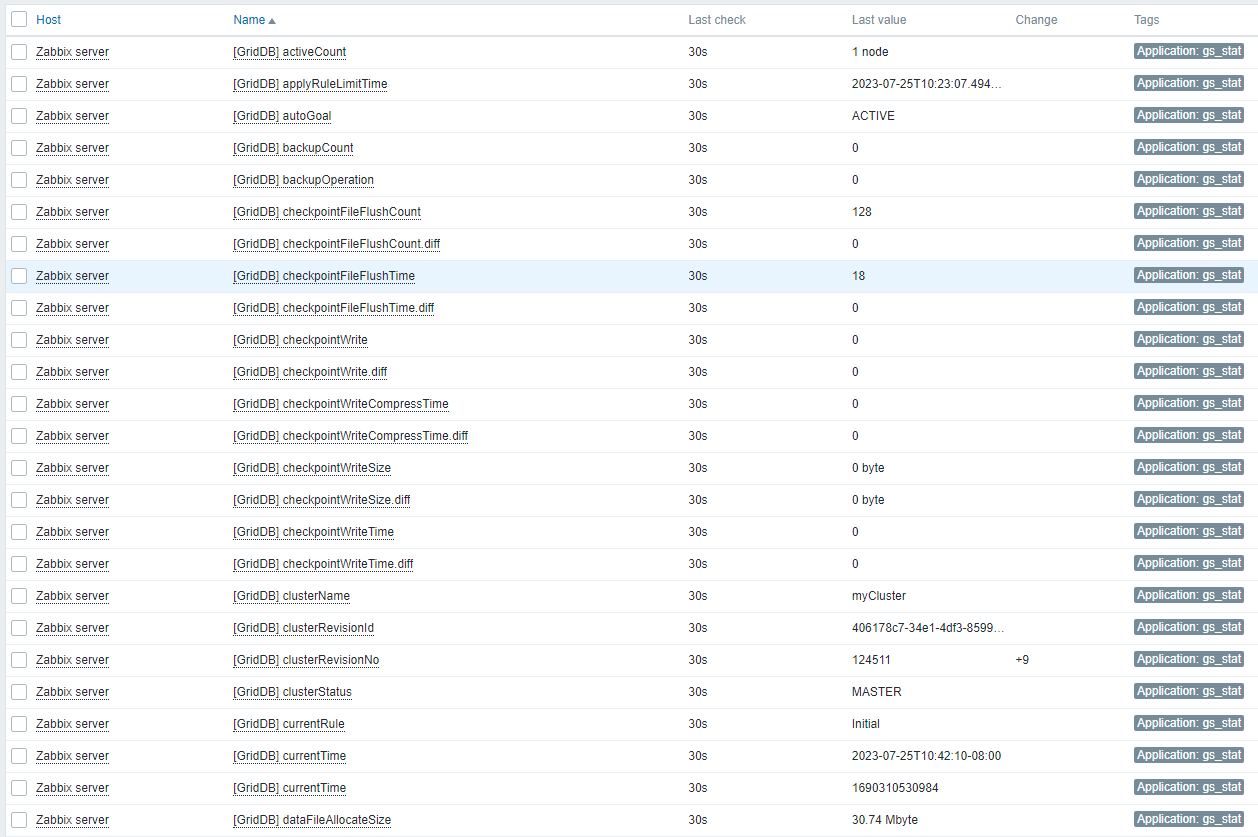
Once that is done, you will be able to see your GridDB properties by going to Monitoring –> Latest data. When on this page, click on gs_stat from the application tags, for example, to see your GridDB gs_stat information. Very cool!
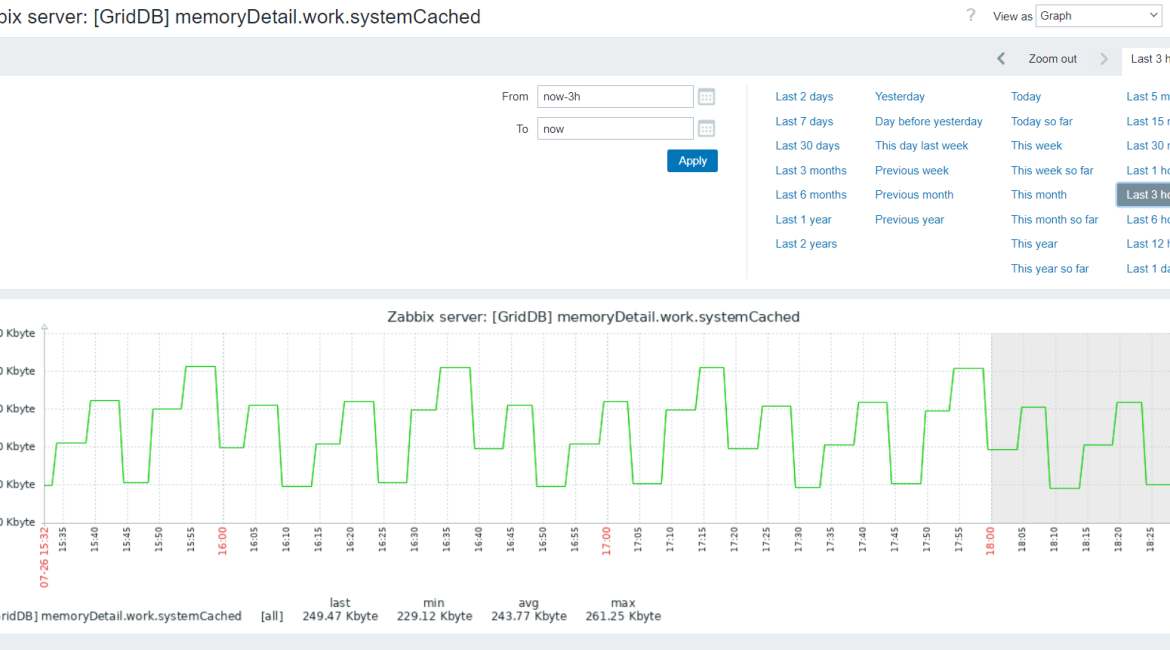
You can click on the graphs associated with a certain metric to better visualize your data as well. Like so:
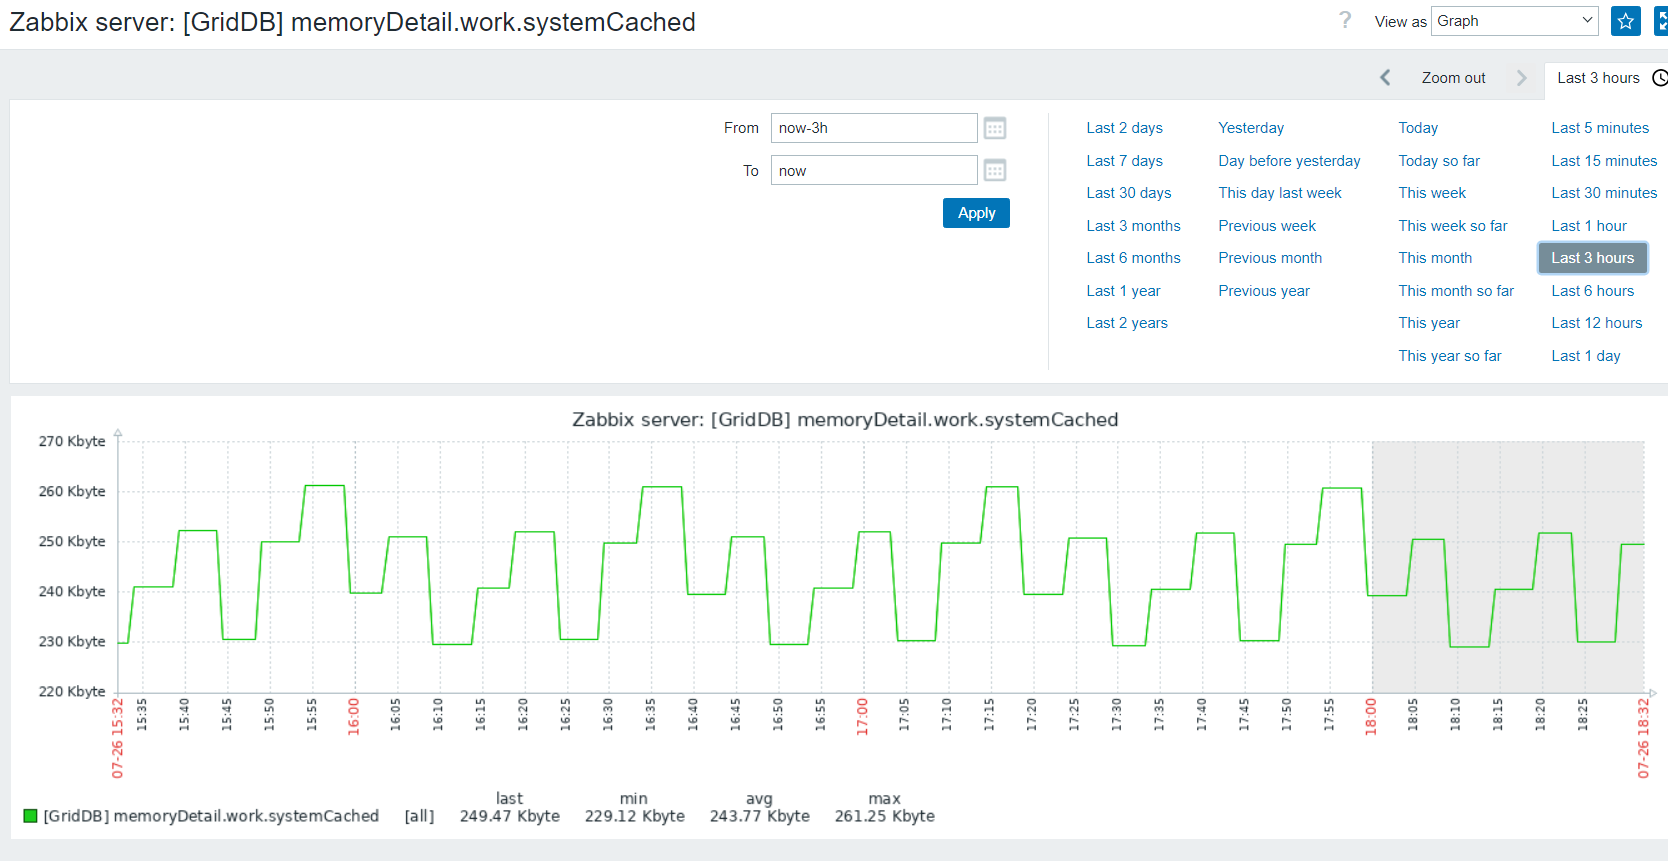
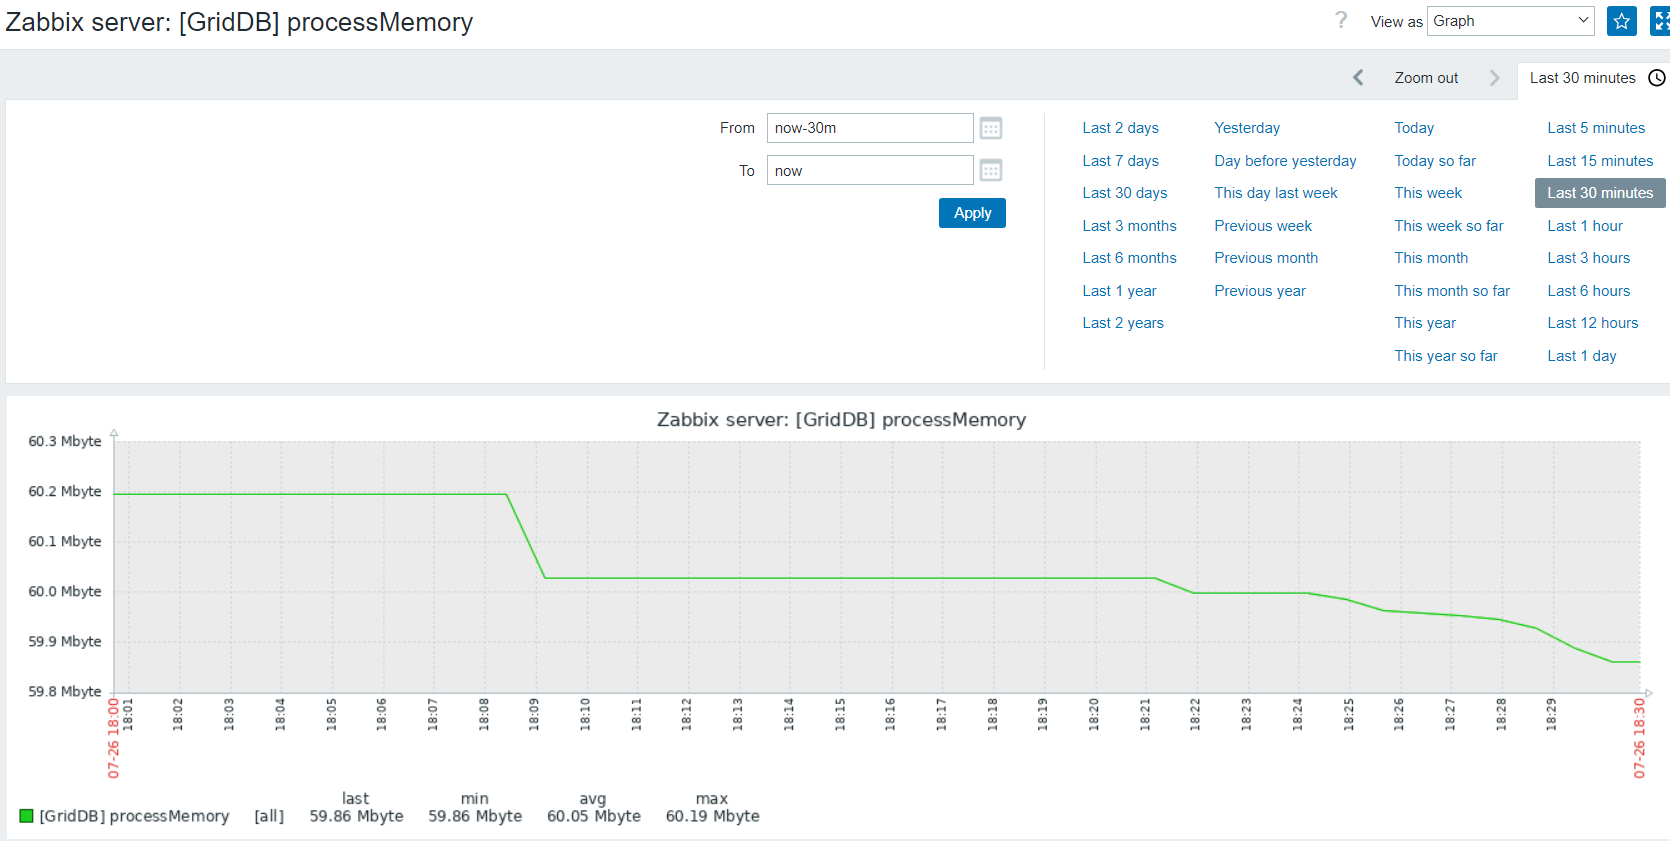
And like so:
Conclusion
And with that, you can now monitor your GridDB Instance right alongside all of your other services in Zabbix!