
In this demonstration, we show how you to build a low cost Industrial Internet of Things (IIoT) solution using GridDB on a Raspberry Pi 4 with a Node-Red flow that uses MQTT to read temperature sensor data from an Industrial Shields M-DUINO 21+ Arduino PLC and then visualizes that data using Grafana.
Table of Contents
Hardware Setup
For the hardware setup, we’re going to mount the hardware to a DIN rail, wire the temperature sensor, setup the Arduino IDE, and deploy our Arduino sketch to the PLC.
We mounted the Raspberry Pi4 to a DINRplate for a clean installation on a DIN rail and are using a generic terminal block from Amazon. Having everything mounted on the DIN rail will keep it neat and tidy, something very beneficial if you have 100s of temperature sensors.
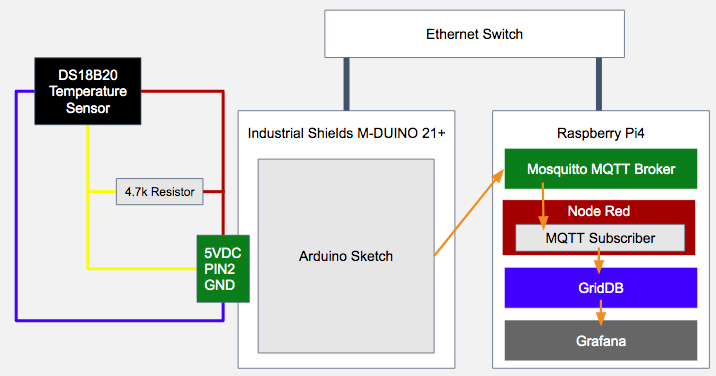
The ground wire of the temperature sensor is connected to the M-DUINO’s ground pin. The 5 volt wire is also connected to the M-DUINO’s +5 VDC pin. The sensor wire is connected to Pin2 and a 4.7k Ohm resistor is placed between the +5 VDC bus and the sensor bus. Multiple DS18B20 sensors can be attached to the same M-DUINO pin if you have a large enough terminal block which is one advantage of using the DS18B20 over using an Analog sensor.
Raspberry Pi Setup
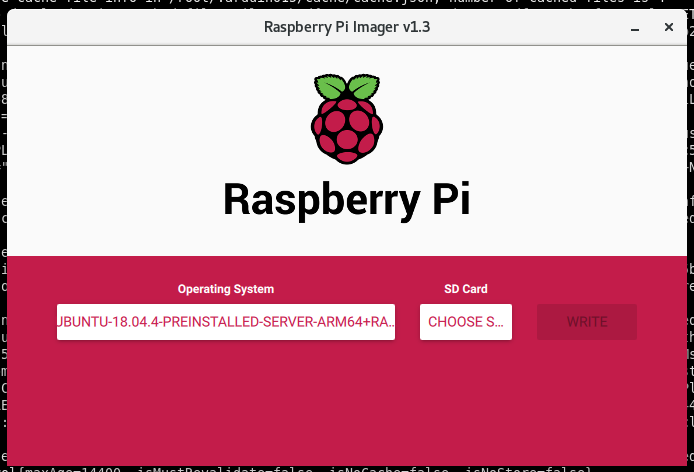
First, we’re going to start by getting our Raspberry PI up and running. We need to install Ubuntu and build and install the GridDB Server, NodeJS, GridDB NodeJS Client along with Node Red and the Nodes we’ll be using. GridDB needs to run on a 64-bit OS, so we’ll use Pi Imager to write a 64-bit Ubuntu 18.04 server image to our micro SD card.
MQTT
We’ll use the Mosquitto MQTT broker on the Raspberry PI. The M-DUINO will publish messages to a topic on the broker while Node-RED will subscribe to that topic. No configuration is required for our simple demo, so we simply install and start.
sudo apt-get -y install mosquitto
sudo systemctl enable mosquitto
sudo systemctl start mosquitto
Arduino Setup
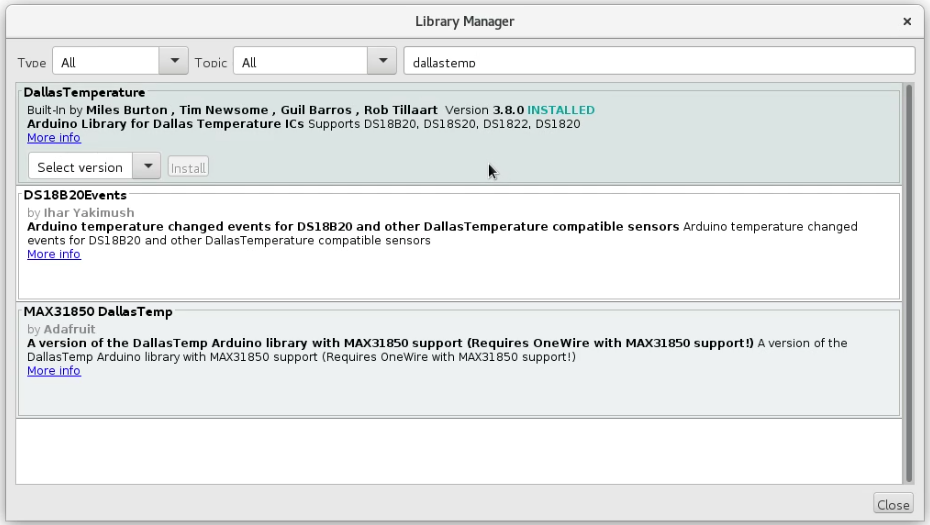
After installing and starting the Arduino IDE for your preferred OS (It can be on the Raspberry Pi but I prefer to connect it directly to my development workstation) install the Arduino Modbus and DallasTemperature libraries into the Arduino IDE.
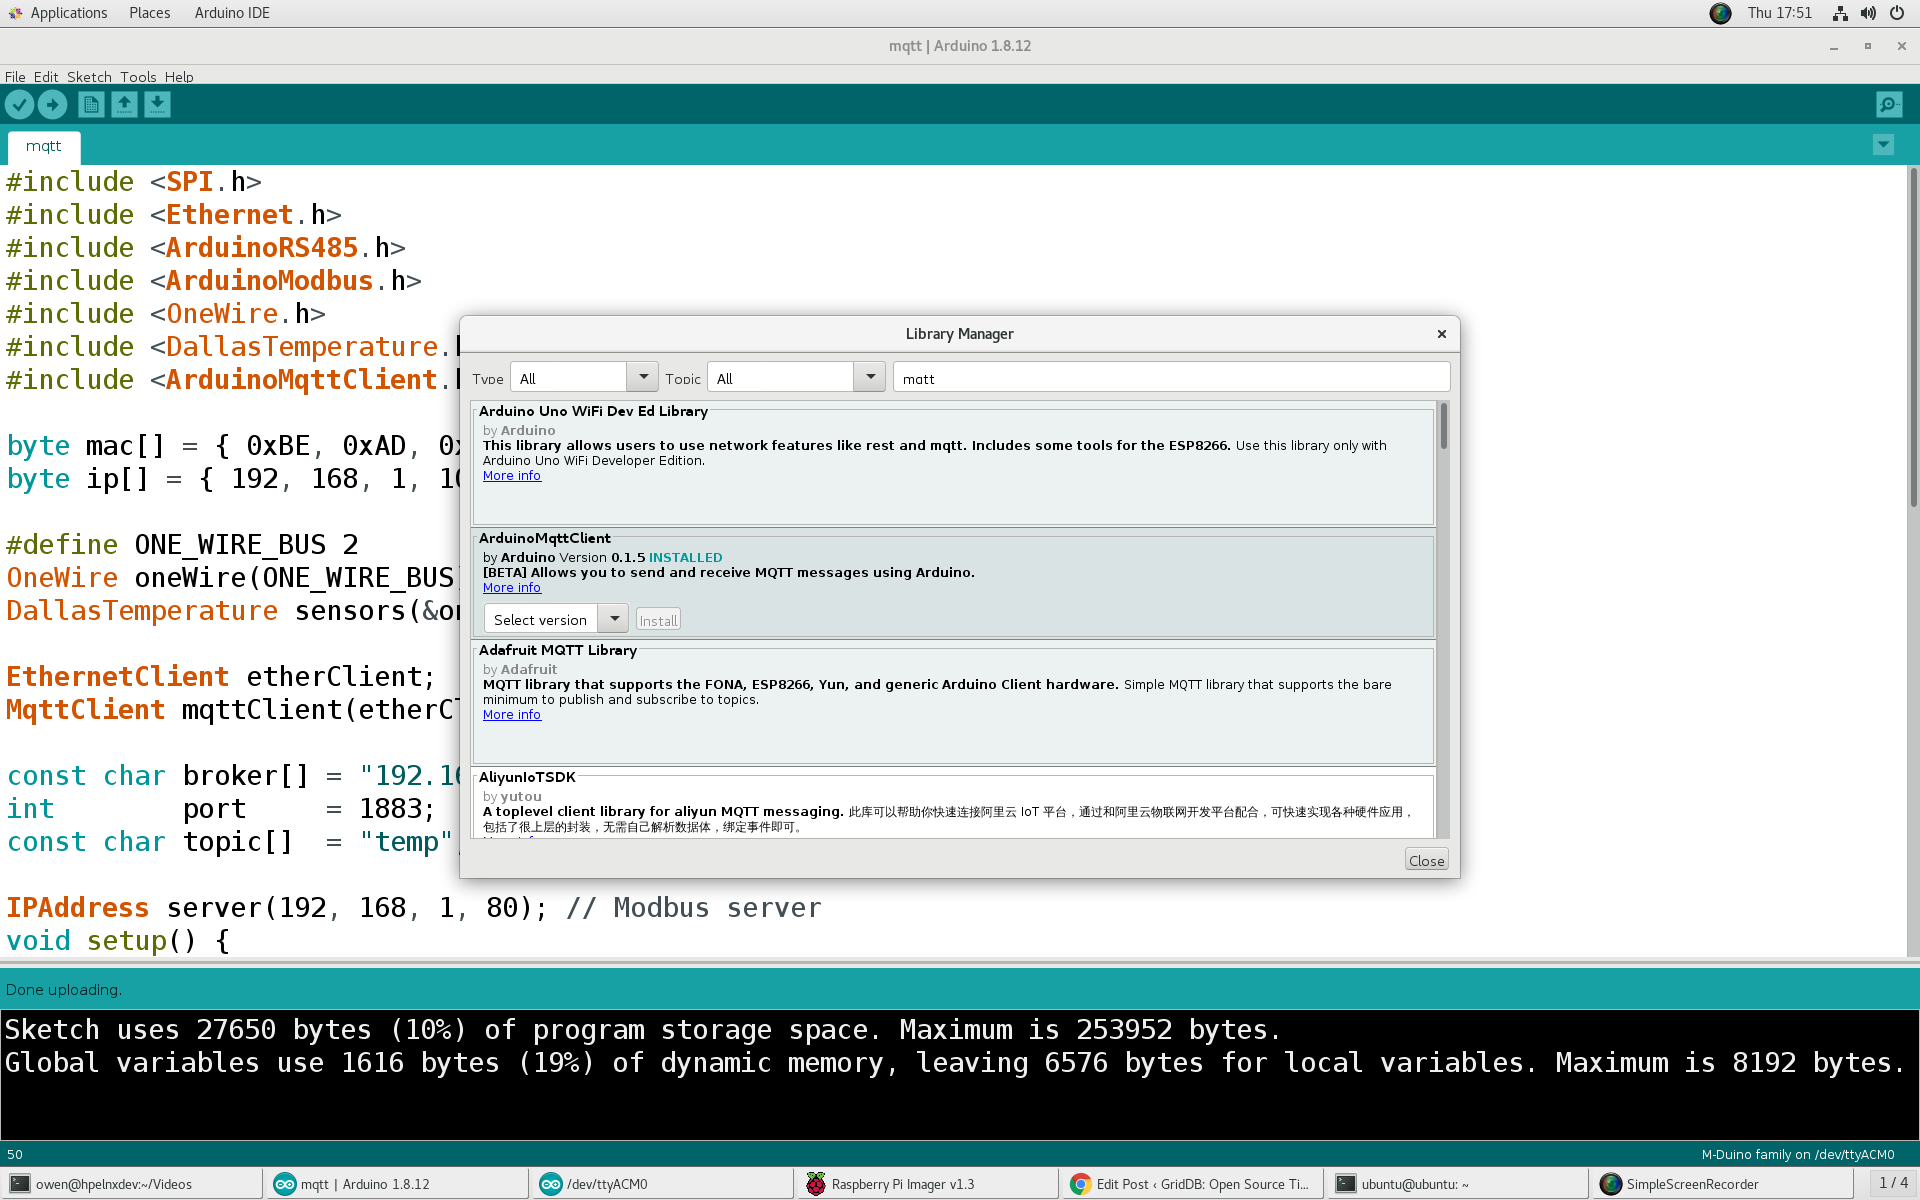
For the Arduino setup, the required headers are included and our M-Duino’s mac and ip address are configured. We’re using PIN2 to receive the signal from our DS18B20 so we configure the OneWire library appropriately.
Then we configure the MQTT broker address which will run on the Raspberry Pi. The actual startup routine simply starts ethernet, serial and connects to the MQTT broker.
#include <SPI.h>
#include <Ethernet.h>
#include <ArduinoRS485.h>
#include <OneWire.h>
#include <DallasTemperature.h>
#include <ArduinoMqttClient.h>

byte mac[] = { 0xBE, 0xAD, 0xBE, 0xEF, 0xFE, 0xED };
byte ip[] = { 192, 168, 1, 100 };

#define ONE_WIRE_BUS 2
OneWire oneWire(ONE_WIRE_BUS);
DallasTemperature sensors(&oneWire);

EthernetClient etherClient;
MqttClient mqttClient(etherClient);

const char broker[] = "192.168.1.69";
int        port     = 1883;
const char topic[]  = "temp";

IPAddress server(192, 168, 1, 80); // Modbus server
void setup() {

  Ethernet.begin(mac, ip);
  Serial.begin(9600);

  if (!mqttClient.connect(broker, port)) {
    Serial.print("MQTT connection failed! Error code = ");
    Serial.println(mqttClient.connectError());

    while (1);
  }

  Serial.println("Connected to the MQTT broker!");

}
The Arduino’s loop function runs every second, collecting the temperature and publishing it to the MQTT broker.
void loop() {

    sensors.requestTemperatures();
    float temp = sensors.getTempCByIndex(0);
    Serial.print("Temperature is: ");
    Serial.println(temp);

    mqttClient.beginMessage(topic);
    mqttClient.print("{ "sensor" : 1, "temperature" : ");
    mqttClient.print(temp);
    mqttClient.print(" }");
    mqttClient.endMessage();

    delay(1000);

}
Now with our Arduino code complete we can compile, upload and verify it’s working.
GridDB and GridDB WebAPI Setup
Now that you can log into the Pi, we can follow this blog post on how to compile and run GridDB on an ARM64-based Raspberry Pi.
Once GridDB is running, we can download and install the WebAPI:
$ wget https://github.com/griddb/webapi/releases/download/2.2.0/griddb_webapi-2.2.0-bin.tar.gz
$ tar zxvf griddb_webapi-2.2.0-bin.tar.gz
$ cd webapi/
$ export GS_WEBAPI_HOME=/home/ubuntu/webapi
$ nohup java -jar ./lib/griddb-webapi-ce-2.2.0.jar &
NodeJS, NodeJS GridDB Client
To build the Node.js client required for Node-RED, we need to install Node.js, its development headers, and node native abstractions for Node.js.
$ sudo apt-get install nodejs nodejs-dev node-nan
Now we need to build dependencies for the Node.js GridDB client, PCRE and SWIG.
$ export LD_LIBRARY_PATH=/usr/local/lib
$ wget https://sourceforge.net/projects/pcre/files/pcre/8.39/pcre-8.39.tar.gz
$ tar xvfz pcre-8.39.tar.gz
$ cd pcre-8.39
$ ./configure
$ make
$ make install

$ wget https://prdownloads.sourceforge.net/swig/swig-4.0.0.tar.gz
$ tar xvfz swig-4.0.0.tar.gz
$ cd swig-3.0.12
$ ./configure
$ make
$ make install
With the prerequisites built, we can clone and build the Node.js GridDB client.
$ git clone https://github.com/griddb/nodejs_client.git
$ cd nodejs_client && make
Node Red Setup
Install Node Red
Now we can install Node Red and the Nodes we’re going to use:
The GridDB Node Red Node isn’t available from npm yet,
$ npm install node-red
$ git clone https://github.com/griddbnet/node-red-contrib-griddb.git
$ mkdir ~/.node-red
$ cd ~/.node-red
$ npm install ~/node-red-contrib-griddb
Now we add the GridDB Client to our NODE_PATH and start node red.
# export NODE_PATH=:/home/ubuntu/nodejs_client
# ~/node_modules/node-red/bin/node-red-pi
Node Red Flows
First we’ll add a MQTT listener in Node-RED that subscribes to the temp topic.
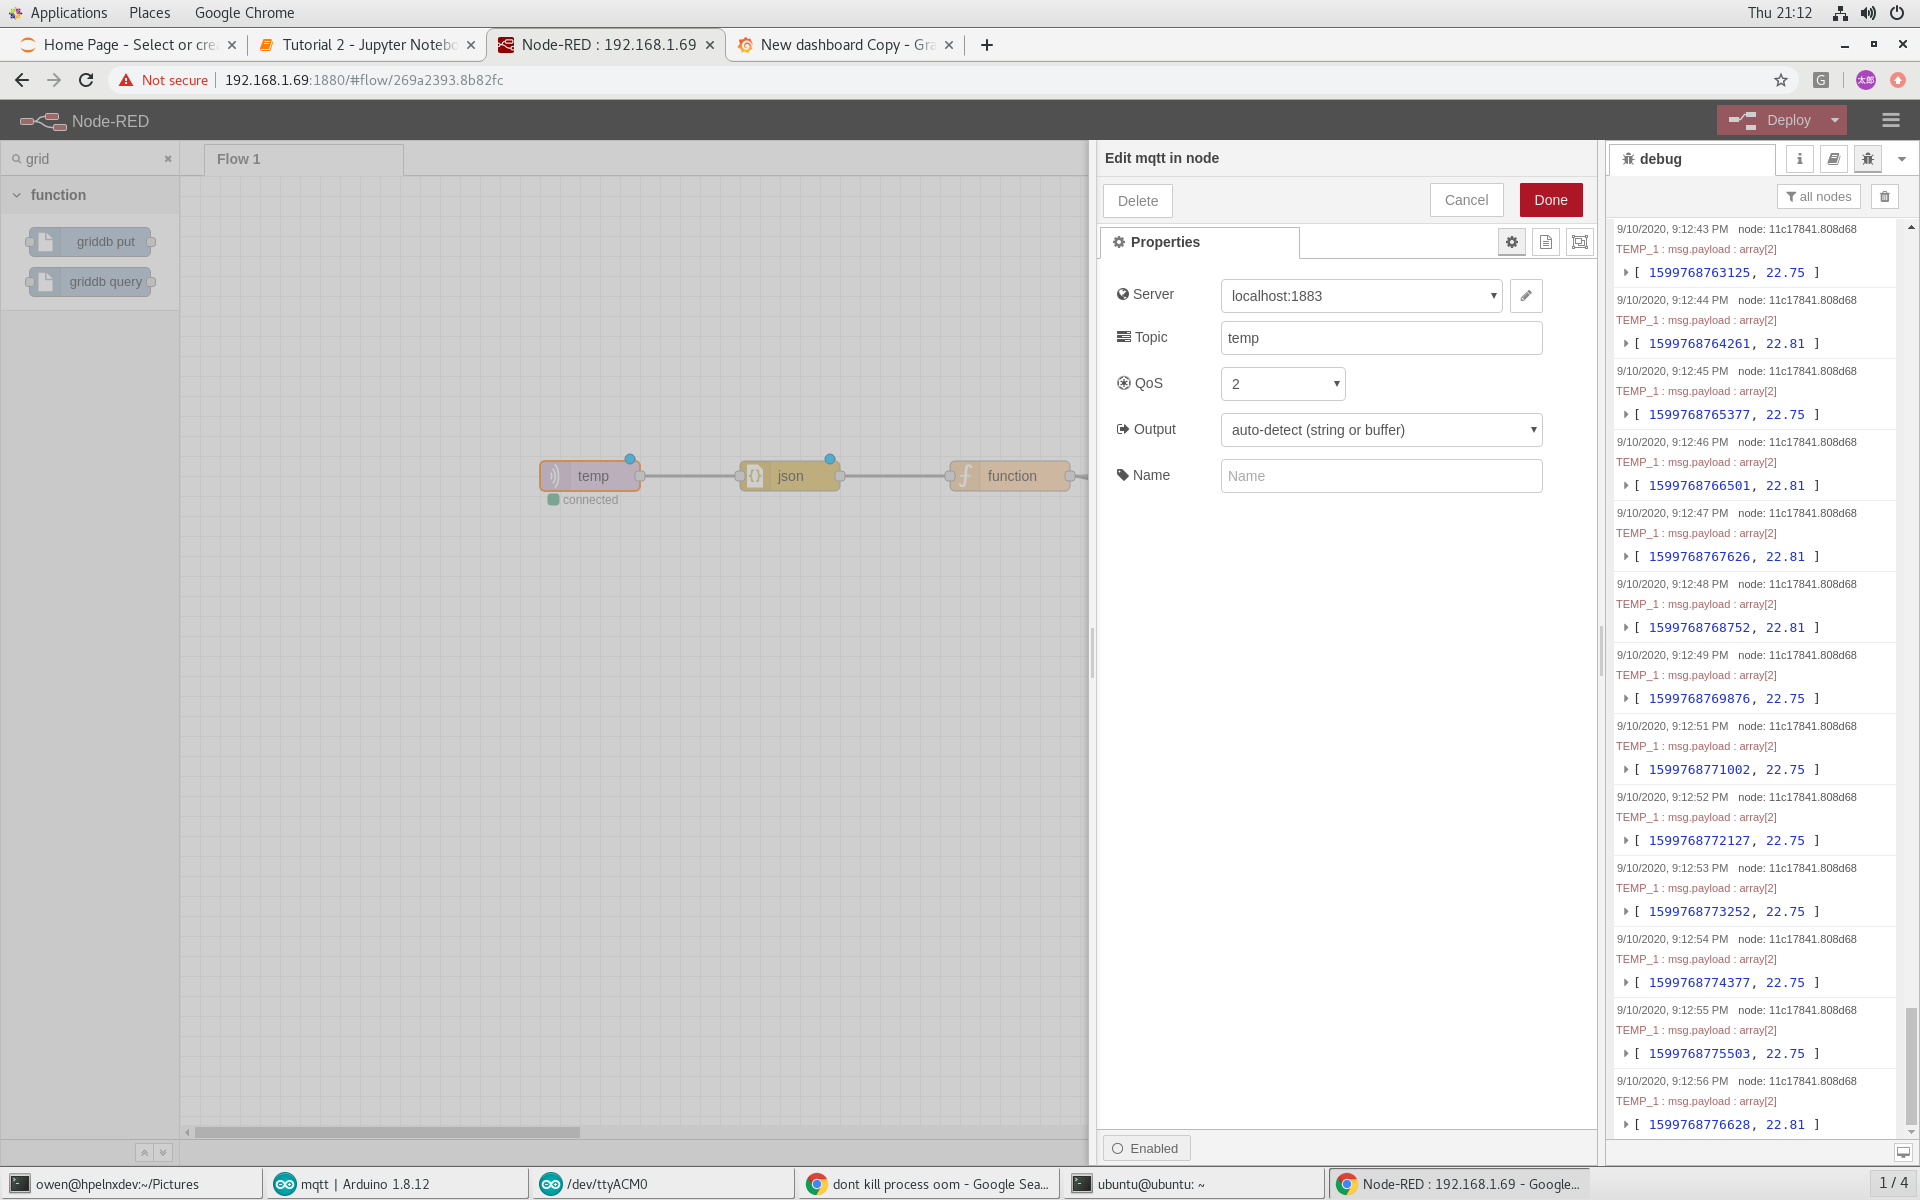
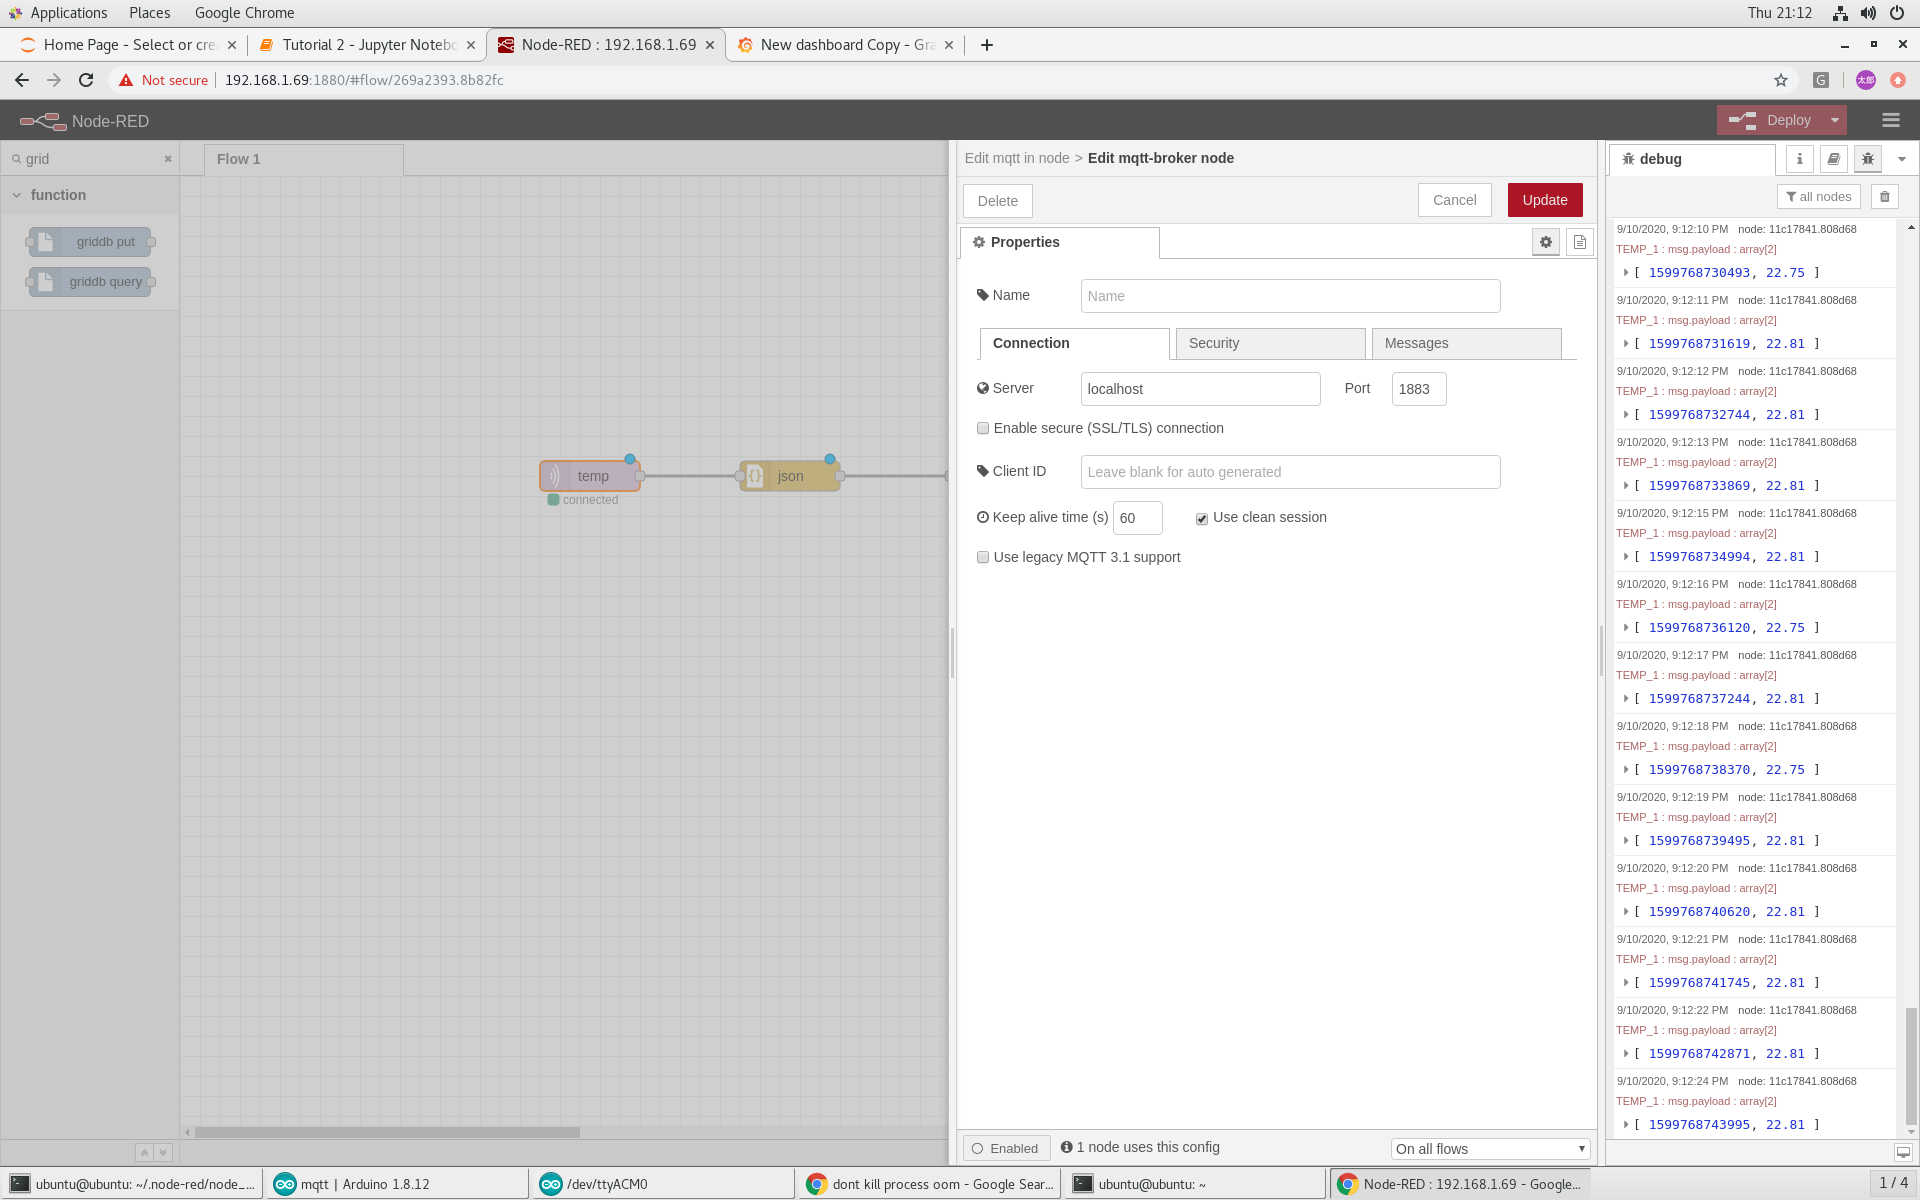
For the listener to work, it needs to have a MQTT broker configured, in this case our broker is running on localhost and no special authorization is required.
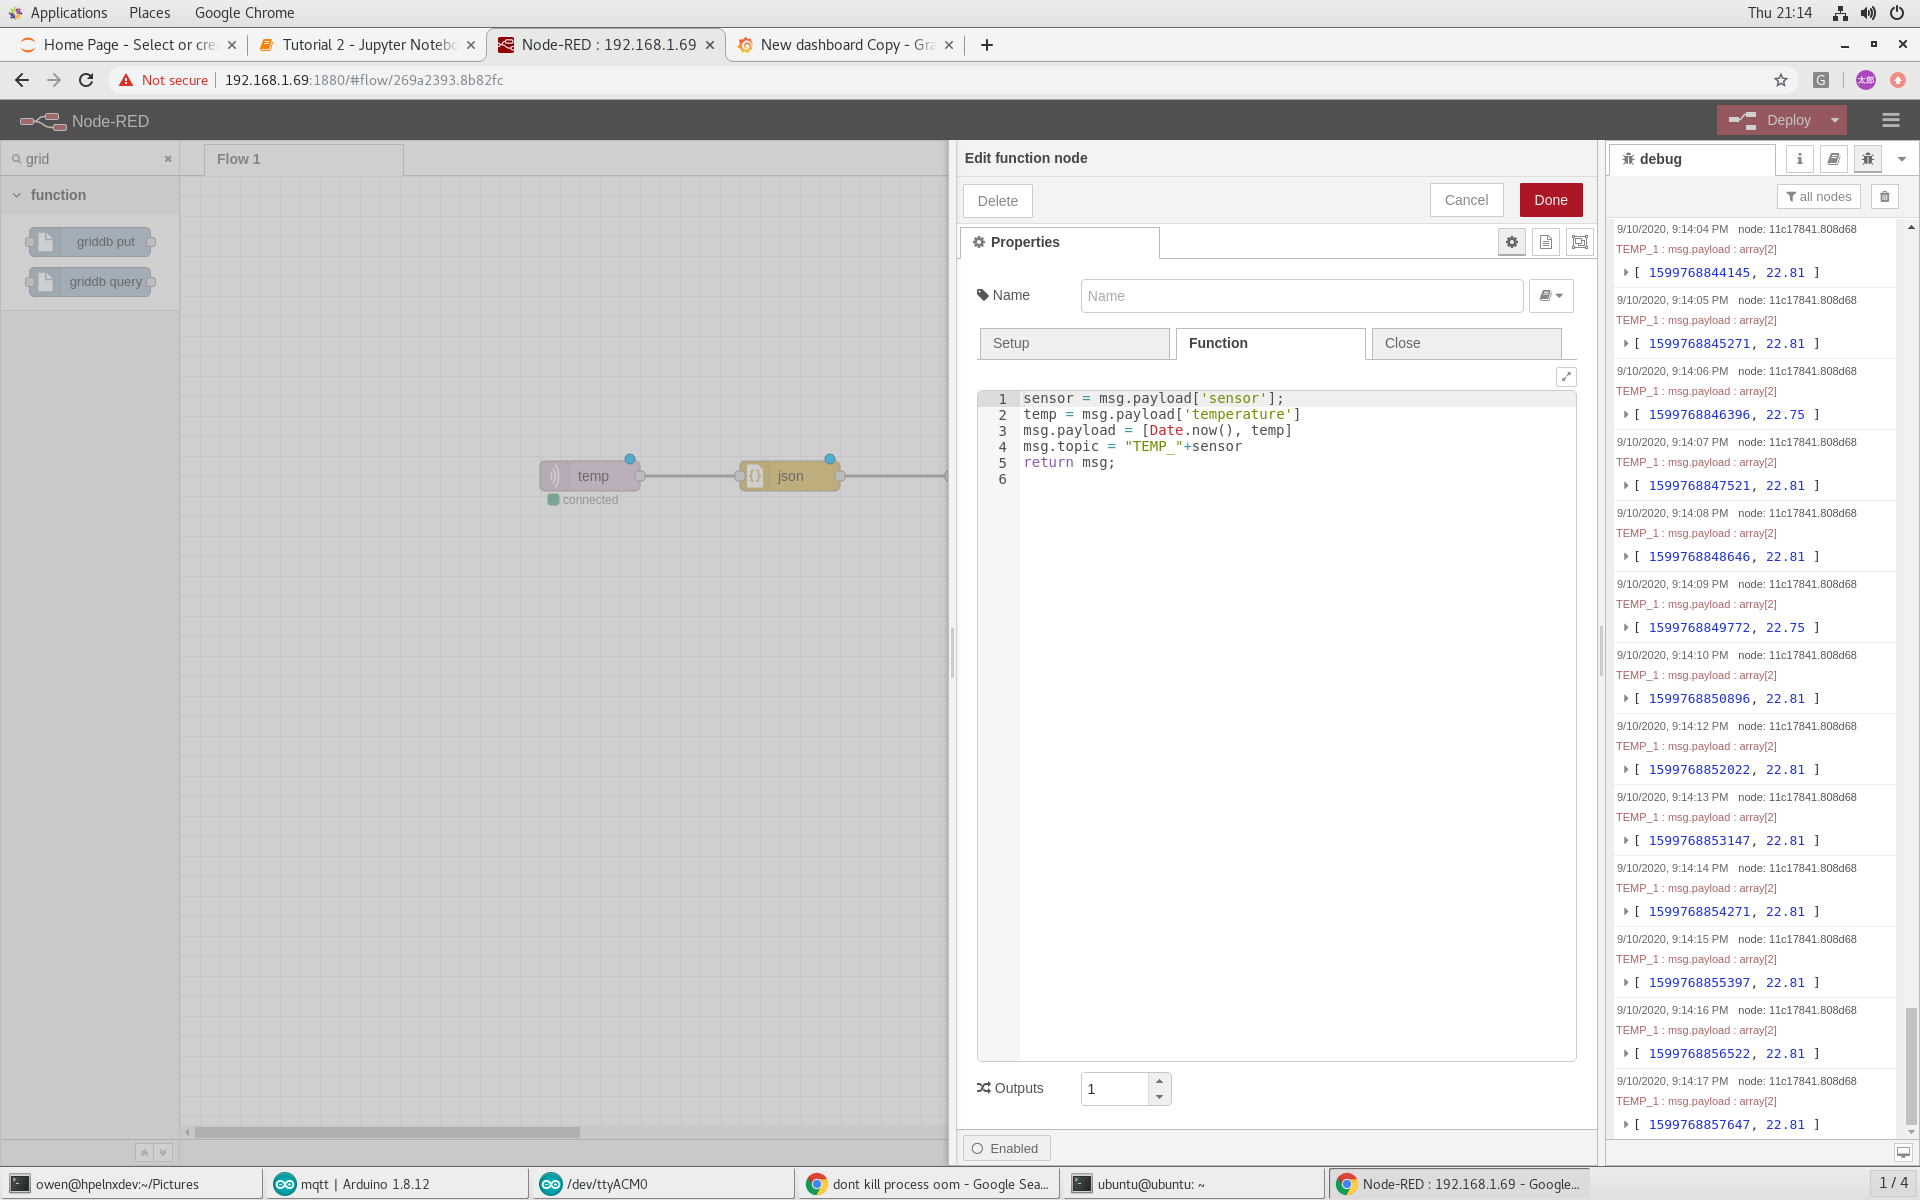
The output of the MQTT listener is converted from a string into a JSON object before being converted into the format the GridDB PUT node expects.
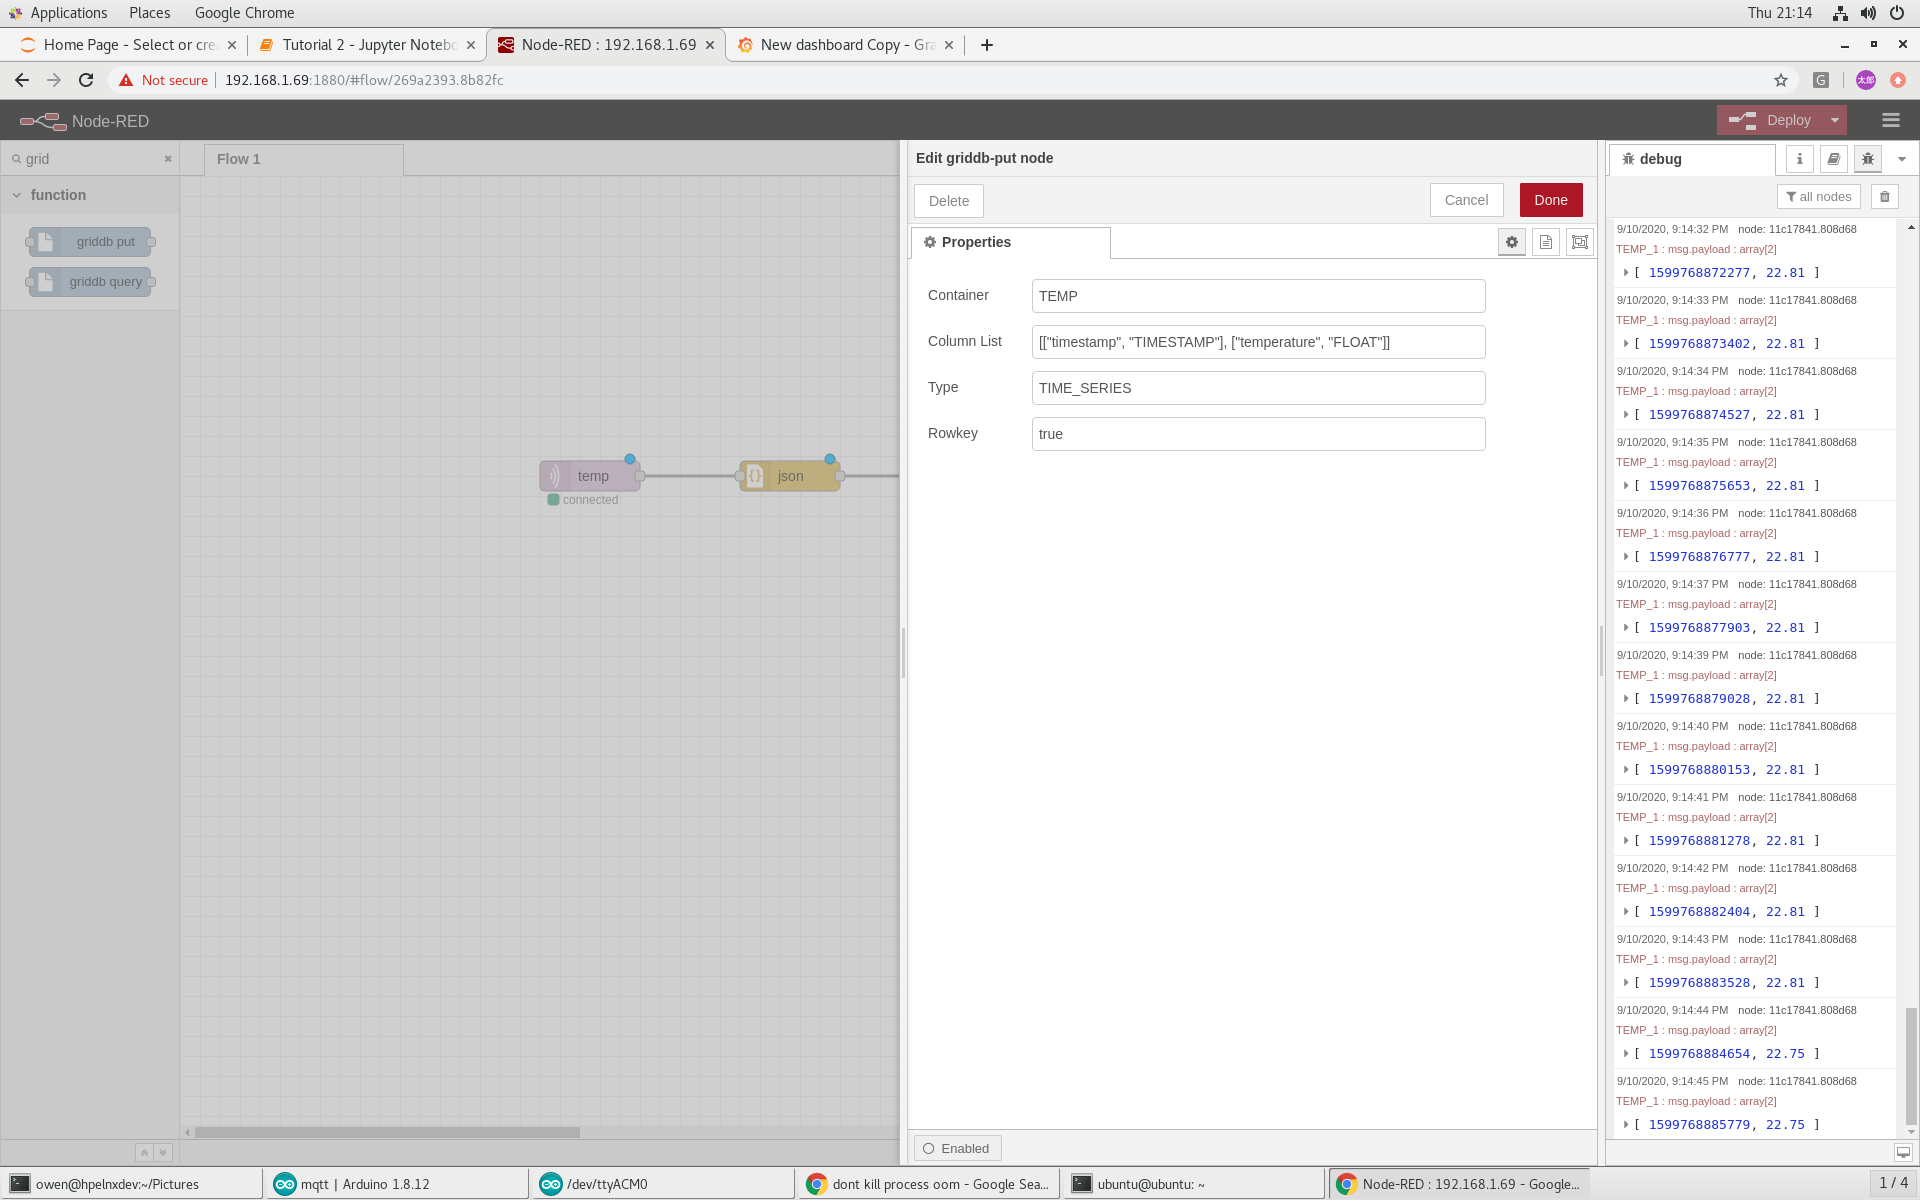
Finally the GridDB-Put node has the data schema configured for what it is input. Here, the Container name is not required as the container is specified by msg.topic in the input. This way, multiple sensors can have their data written to multiple containers without individual GridDB-Put nodes.
Grafana
We can install and start Grafana per their instructions”:
wget -q -O - https://packages.grafana.com/gpg.key | sudo apt-key add -
echo "deb https://packages.grafana.com/oss/deb stable main" | sudo tee -a /etc/apt/sources.list.d/grafana.list
sudo apt-get update
sudo apt-get install grafana
sudo systemctl enable grafana-server
sudo systemctl start grafana-server
Then we download and install the Grafana GridDB Datasource:
wget https://github.com/griddb/griddb-datasource/archive/1.1.0.tar.gz
tar zxvf 1.1.0.tar.gz
sudo cp -a griddb-datasource-1.1.0/dist /var/lib/grafana/plugins
sudo systemctl restart grafana-server
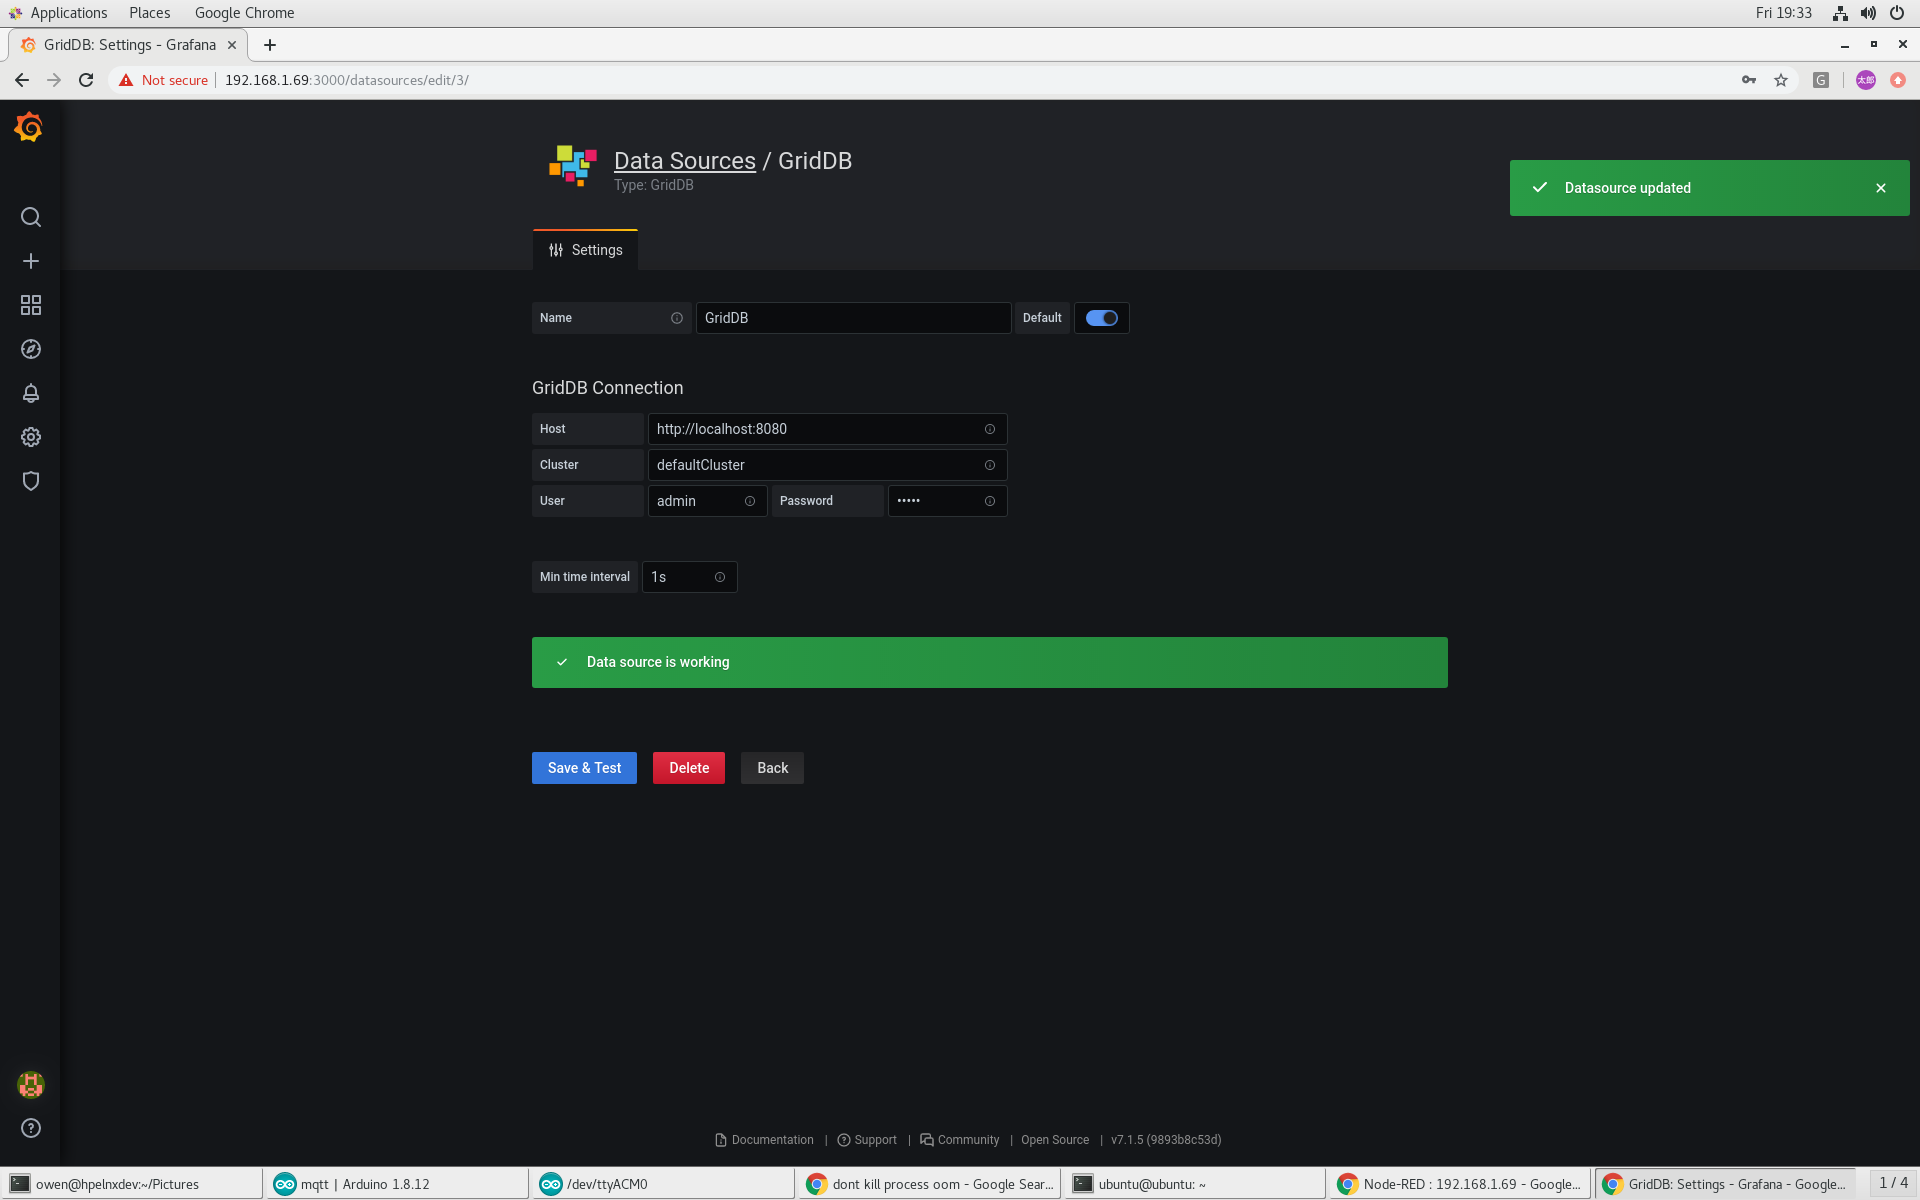
Now with Grafana running, we can log in with our web browser.
The first step will be too create a GridDB data source and confirm it works by inputing hostname, port, cluster name, username and password.
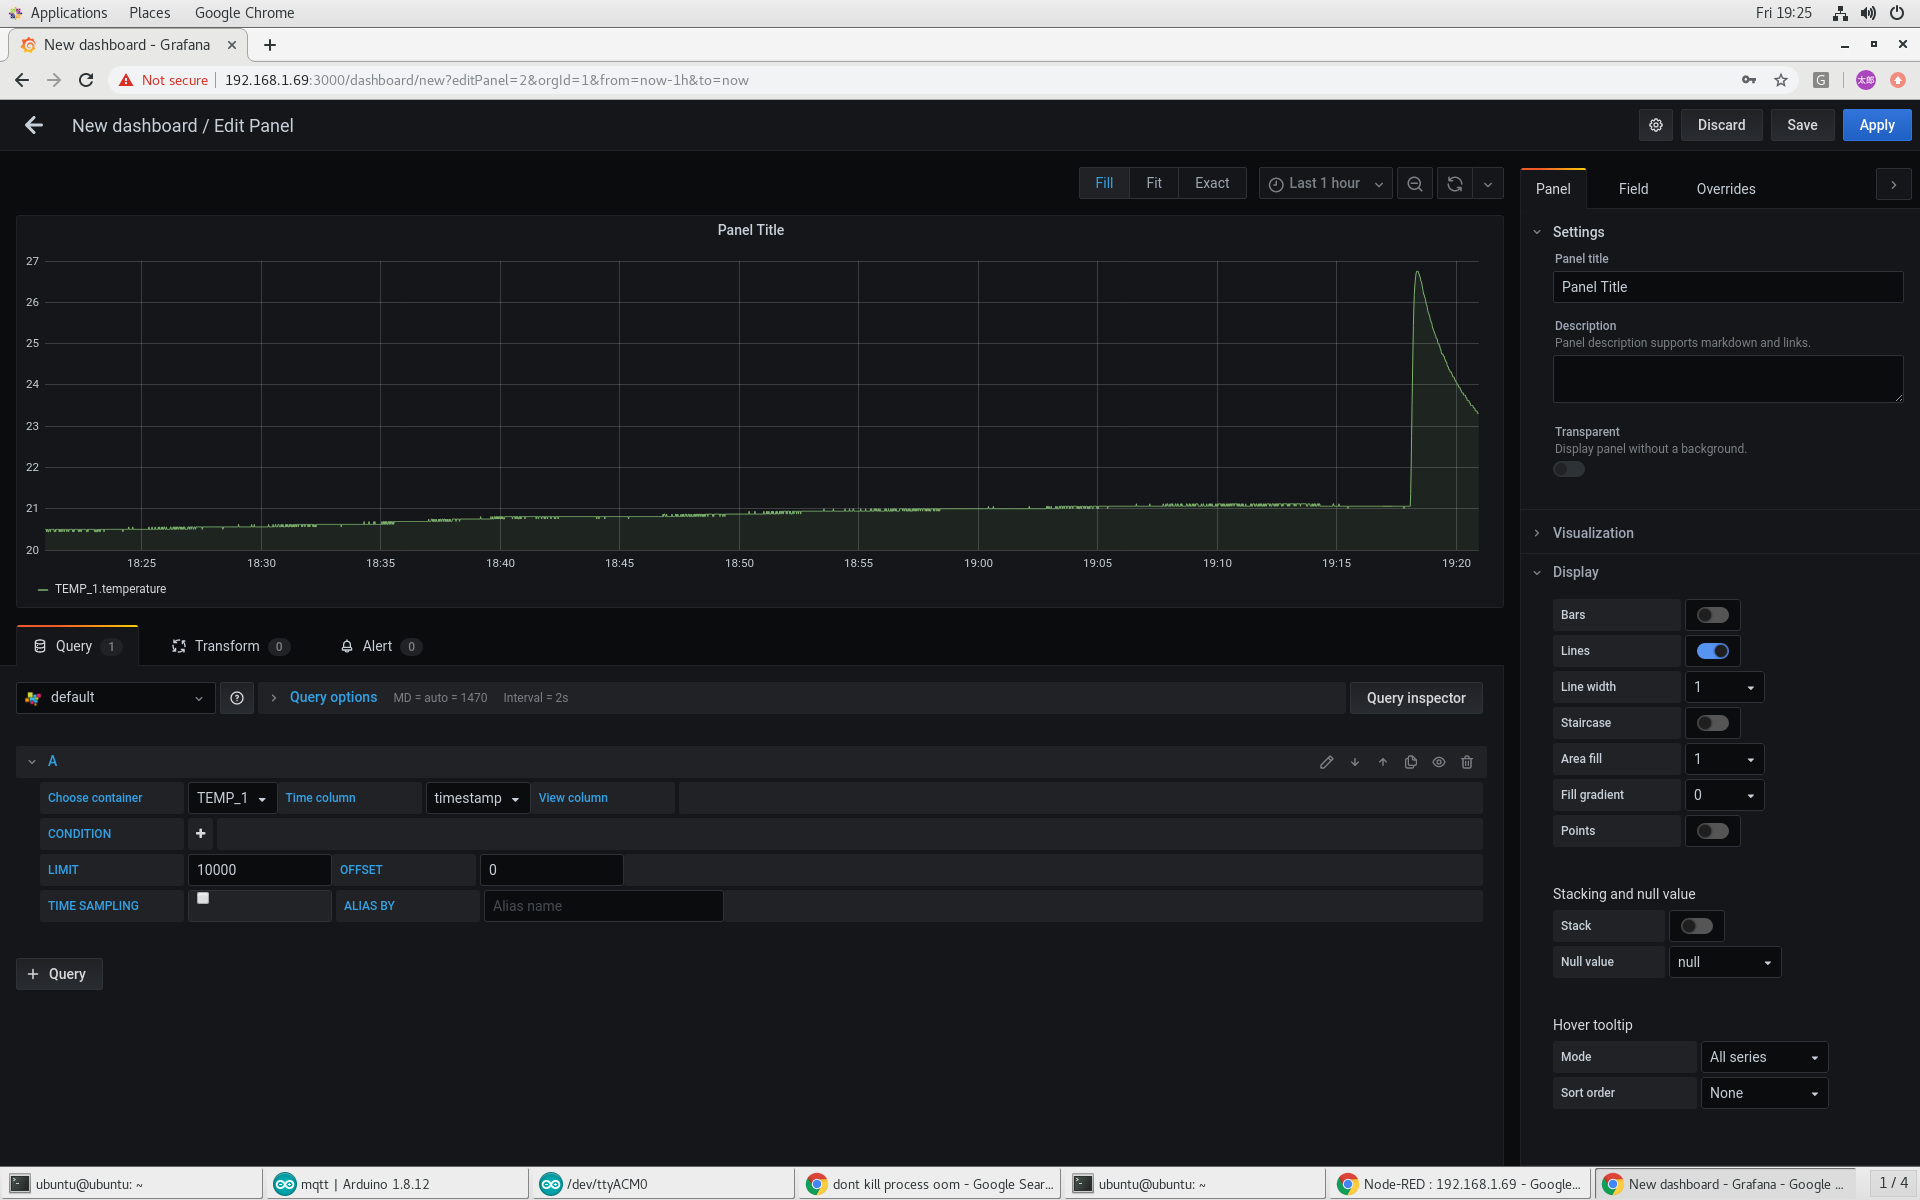
With the data source working, we can create a panel in a dashboard. We select which container to view and and the time series column and the data is plotted. Grafana makes it easy to zoom in and out of the data ranges to examine details or explore long term trends.
If you have any questions regarding this project or anything else related to GridDB, please feel free to ask on StackOverflow: https://stackoverflow.com/questions/ask?tags=griddb