
In this blog, we’ll take a look at some open data provided by the NYC Taxi Commission and showcase some simple scripts to ingest and analyze the data. The principles shown here are applicable to many different types of problems.
If you haven’t set up a GridDB server yet, follow this quickstart. If you need to setup GridDB for Node.js, this blog will get you up and running. You can download and find further details about the NYC Taxi data on the NYC Open Data website.
Data Model
VendorID,tpep_pickup_datetime,tpep_dropoff_datetime,passenger_count,trip_distance,RatecodeID,store_and_fwd_flag,PULocationID,DOLocationID,payment_type,fare_amount,extra,mta_tax,tip_amount,tolls_amount,improvement_surcharge,total_amount
2,03/13/2018 02:58:38 PM,03/13/2018 03:00:22 PM,1,0.31,1,N,132,132,2,3.5,0,0.5,0,0,0.3,4.3
1,03/13/2018 02:34:11 PM,03/13/2018 02:40:35 PM,1,2.3,1,N,132,132,1,9,0,0.5,1.95,0,0.3,11.75
1,03/13/2018 02:42:12 PM,03/13/2018 03:21:44 PM,1,17.5,2,N,132,230,1,52,0,0.5,5,5.76,0.3,63.56
1,03/13/2018 02:36:05 PM,03/13/2018 03:04:08 PM,1,10.5,1,N,230,138,1,32.5,0,0.5,7.8,5.76,0.3,46.86
1,03/13/2018 02:41:52 PM,03/13/2018 02:45:41 PM,1,0.7,1,N,264,264,2,5,0,0.5,0,0,0.3,5.8
1,03/13/2018 02:47:40 PM,03/13/2018 02:55:06 PM,1,1.3,1,N,264,264,1,7,0,0.5,2,0,0.3,9.8
1,03/13/2018 02:27:57 PM,03/13/2018 02:48:45 PM,1,4.8,1,N,142,13,1,18.5,0,0.5,3.85,0,0.3,23.15
1,03/13/2018 02:03:27 PM,03/13/2018 02:10:51 PM,1,0.6,1,N,164,100,1,6,0,0.5,1.36,0,0.3,8.16
1,03/13/2018 02:12:58 PM,03/13/2018 02:25:04 PM,1,1,1,N,100,230,2,8.5,0,0.5,0,0,0.3,9.3
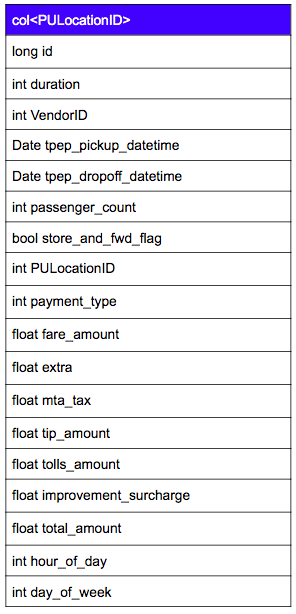
The open data has 17 fields so our first decision is to determine how to split the data into multiple containers. The ideal method would be for the data from each individual taxi cab to be put in individual containers, but a unique identifier for each cab is not provided as the data is anonymized. The next best field to use is PULocationID, which is an integer from 1-265 which represents a unique identifier of each of the New York MTA neighborhoods.
Since different taxi cabs could be picking up passengers at the exact same time in the exact same neighbourhood, tpep_pickup_datetime does not make a good primary key. Instead, we’ll have to use a unique integer that is incremented for every row added.
We also add a few calculated fields: hour_of_day and day_of_week which will be useful in the analysis of the taxi data.
var colInfo = new griddb.ContainerInfo({
    'name': "col"+data['PULocationID'],
    'columnInfoList': [
        ["id" , griddb.Type.LONG],
        ["duration" , griddb.Type.INTEGER],
        ["VendorID", griddb.Type.INTEGER ],
        ["tpep_pickup_datetime", griddb.Type.TIMESTAMP ],
        ["tpep_dropoff_datetime", griddb.Type.TIMESTAMP ],
        ["passenger_count", griddb.Type.LONG],
        ["store_and_fwd_flag" , griddb.Type.BOOL],
        ["PULocationID", griddb.Type.INTEGER],
        ["DOLocationID", griddb.Type.INTEGER],
        ["payment_type", griddb.Type.INTEGER],
        ["fare_amount", griddb.Type.FLOAT],
        ["extra", griddb.Type.FLOAT],
        ["mta_tax", griddb.Type.FLOAT],
        ["tip_amount", griddb.Type.FLOAT],
        ["tolls_aount", griddb.Type.FLOAT],
        ["improvement_surcharge", griddb.Type.FLOAT],
        ["total_amount", griddb.Type.FLOAT],
        ["hour_of_day", griddb.Type.INTEGER],
        ["day_of_week", griddb.Type.INTEGER]],
   'type': griddb.ContainerType.COLLECTION, 'rowKey': true
});
|
|
Ingestion
The actual ingestion process is quite simple using the csv-parser npm module. Data is streamed from and processed by the CSV parser and then we convert it to a simple array that is put into the appropriate GridDB container.
var griddb = require('griddb_node');
var fs = require('fs');
var csv = require('csv-parser')

let factory = griddb.StoreFactory.getInstance();
let store = factory.getStore({
    "host": '239.0.0.1',
    "port": 31999,
    "clusterName": "defaultCluster",
    "username": "admin",
    "password": "admin"
});

let cols = {}
let count=0

fs.createReadStream('data.csv')
  .pipe(csv())
  .on('data', (data) => {
    let row = []
    row[0] = count++;
    row[1] = parseInt(Date.parse(data['tpep_dropoff_datetime'])-Date.parse(data['tpep_pickup_datetime']))/1000)
    row[2] = parseInt(data['VendorID'], 10);
    row[3] = Date.parse(data['tpep_pickup_datetime'])
    row[4] = Date.parse(data['tpep_dropoff_datetime'])
    row[5] = parseInt(data['passenger_count'], 10)
    if(data['store_and_fwd_flag'] == 'Y')
        row[6] = true
    else
        row[6] = false
    row[7] = parseInt(data['PULocationID'])
    row[8] = parseInt(data['DOLocationID'])
    row[9] = parseInt(data['payment_type'])
    row[10] = Number(data['fare_amount'])
    row[11] = Number(data['extra'])
    row[12] = Number(data['mta_tax'])
    row[13] = Number(data['tip_amount'])
    row[14] = Number(data['tolls_amount'])
    row[15] = Number(data['improvement_surcharge'])
    row[16] = Number(data['total_amount'])
    let date = new Date(row[3])
    row[17] = date.getHours()
    row[18] = date.getDay()

    var colInfo = . . . snipped above . . .
    store.putContainer(colInfo, false)
        .then(cont => {
            cont.put(row)
            console.log(row[0])
        })
    .catch(err => {
        if (err.constructor.name == "GSException") {
            for (var i = 0; i < err.getErrorStackSize(); i++) {
                console.log("[", i, "]");
                console.log(err.getErrorCode(i));
                console.log(err.getMessage(i));
            }
        } else {
            console.log(err);
        }
    });
});
Analysis
There are many different queries that could yield interesting results; what was the longest trip? The most expensive?
Which area is the busiest?
// standard boilerplate
var griddb = require('griddb_node');
var fs = require('fs');
var csv = require('csv-parser')

// our Cluster's credentials
let factory = griddb.StoreFactory.getInstance();
let store = factory.getStore({
    "host": '239.0.0.1',
    "port": 31999,
    "clusterName": "defaultCluster",
    "username": "admin",
    "password": "admin"
});

let promises = []
let results = {}

var iterate = function(locID) {
    return function(rowset) {
        if(rowset != null) {
            if (rowset.hasNext()) {
                row = rowset.next();
                results[locID] = row;
                // if result is an aggregation use this instead
                // results[locID] = row..get(griddb.GS_TYPE_LONG);
            }
        }
    }
}

var query = function (locID) {
    return function(cont) {
        if(cont != null) {
            q = cont.query("SELECT * ORDER BY fare_amount DESC LIMIT 1 ");
            return q.fetch()
        }
    }
}

for (let i=0; i < 100; i++) {
    var locID = i
    promise = store.getContainer("col"+i)
    .then(query(i))
    .then(iterate(i))
    .catch(err => {
        if (err.constructor.name == "GSException") {
            for (var i = 0; i < err.getErrorStackSize(); i++) {
                console.log("[", i, "]");
                console.log(err.getErrorCode(i));
                console.log(err.getMessage(i));
            }
        } else {
            console.log(err);
        }
    })
    promises.push(promise)
}

Promise.all(promises).then(values => {
    var retval=null;
    console.log("sorting...")
    for (var k in results) {
        if (retval == null || results[k][10] > retval[10])
            retval=results[k]
    }
    console.log(retval)
})
The above code finds the most expensive trip which was on March 22 and was over 3 hours long and cost $475 total:
[ 1725438,
  true,
  2,
  2018-03-22T06:43:13.000Z,
  2018-03-22T09:59:34.000Z,
  1,
  false,
  93,
  265,
  1,
  450,
  0,
  0,
  0,
  24.760000228881836,
  0.30000001192092896,
  475.05999755859375,
  6,
  4 ]
With the asynchronous nature of Node.js, two tricks are required: first is determining what the query parameters were (locationID). This one is a bit tricky and is placed within a promise chain and solved with the aid of currying which is where a function is specified in a then() call as follows:
for (let i=0; i < 100; i++) {
    promise=store.getContainer("col"+i) .then(query(i)) .then(iterate(i))
    ...
}
Since all queries execute simultaneously in the background, we need to wait for them to finish.
First we add the query promise to a list:
promises.push(promise)
and then we can wait for all promises to complete:
Promise.all(promises).then(values => {
    // display results
}
To modify this for the longest trip, you'd change "fare_amount" to "duration" and the final comparison key from "10" to "1":
...

            q = cont.query("SELECT * ORDER BY duration DESC LIMIT 1 ");

...

        if (retval == null || results[k][1] > retval[1])

...
If you were interested in the busiest locations, an aggregation query would need to be used which would also change the result fetching and final sorting.
...

var iterate = function(locID) {
    return function(rowset) {
        if(rowset != null) {
            if (rowset.hasNext()) {
                row = rowset.next();
                results[locID] = row.get(griddb.GS_TYPE_LONG);
            }
        }
    }
}

var query = function (locID) {
    return function(cont) {
        if(cont != null) {
            q = cont.query("SELECT COUNT(*)");
            return q.fetch()
        }
    }
}

...

Promise.all(promises).then(values => {
    var items = Object.keys(results).map(function(key) {
        return [key, results[key]];
    });

    items.sort(function(first, second) {
        return second[1] - first[1];
    });

    console.log(items.slice(0, 10))
})
Which outputs the following, we can see area 161 (Manhattan Midtown) is the busiest with 156727 trips.
[ [ '161', 156727 ],
  [ '237', 153388 ],
  [ '162', 144923 ],
  [ '230', 143784 ],
  [ '186', 136234 ],
  [ '236', 136093 ],
  [ '170', 134533 ],
  [ '48', 131547 ],
  [ '234', 130747 ],
  [ '79', 115052 ] ]
More Complex Analysis
The above simple queries provide interesting insights, but a more complex query such as “Which areas are busiest for a given hour of the day?†allow for taxi companies to determine how to deploy their cabs for maximizing profits.
To do this, we can determine how many trips are taken from each neighborhood on a given hour of the day using multiple queries. For each location and each hour, a simple count aggregation is run.
The results are placed into a 2-dimensional dictionary for further processing.
var iterate = function(locID, hour ) {
    return function(rowset) {
        if(rowset != null) {
            while (rowset.hasNext()) {
                row = rowset.next();
                results[hour][locID] = row.get(griddb.GS_TYPE_LONG)
            }
        }
    }
}

var query = function (locID, hour) {
    return function(cont) {
        if(cont != null) {
            q = cont.query("SELECT count(*) where hour_of_day = "+hour);
            return q.fetch()
        }
    }
}

for(let hour=0; hour < 24; hour++) {
    results[hour] = {};
    for (loc=0; loc < 265; loc++)
        results[hour][loc] = 0

    for (let i=0; i < 265; i++) {
        var locID = i
        promise = store.getContainer("col"+i)
        .then(query(i, hour))
        .then(iterate(i, hour))
        .catch(err => {
            if (err.constructor.name == "GSException") {
                for (var i = 0; i < err.getErrorStackSize(); i++) {
                    console.log("[", i, "]");
                    console.log(err.getErrorCode(i));
                    console.log(err.getMessage(i));
                }
            } else {
                console.log(err);
            }
        })
        promises.push(promise)
    }
}
The script then waits for all of the query promises before doing final processing which prints the 10 busiest locations.
Promise.all(promises).then(values => {
    for (hour=0; hour < 24; hour++) {
        var items = Object.keys(results[hour]).map(function(key) {
            return [key, results[hour][key]];
        });

        items.sort(function(first, second) {
            return second[1] - first[1];
        });

        locations = items.map(function(item) {
            return item[0]
        })

        console.log(hour+": "+locations.slice(0, 10))
    }
})
0: 79,230,48,249,148,234,132,161,164,114
1: 79,148,48,230,249,114,164,132,234,68
2: 79,148,48,114,249,68,230,164,158,234
3: 79,148,68,48,230,249,114,164,158,144
4: 79,48,230,148,68,164,249,186,107,114
5: 48,100,132,186,79,230,170,236,107,263
6: 186,48,100,132,236,170,162,68,107,263
7: 186,236,48,170,100,237,141,162,107,140
8: 236,237,170,186,48,141,162,107,140,239
9: 236,237,170,162,186,48,141,239,138,161
10: 237,236,186,138,162,170,161,48,230,142
11: 237,236,161,162,186,170,138,230,142,234
12: 237,236,161,162,186,170,230,234,239,138
13: 237,161,236,162,170,186,234,239,163,230
14: 237,161,236,162,234,170,239,163,138,186
15: 237,161,236,162,234,138,170,186,239,142
16: 161,237,236,162,138,234,132,170,230,239
17: 161,237,162,230,236,234,170,138,163,186
18: 161,162,237,230,234,236,170,163,186,142
19: 161,162,234,237,170,230,186,163,138,142
20: 161,162,234,230,170,237,79,186,48,138
21: 230,161,162,234,48,79,186,138,170,142
22: 230,161,48,79,234,186,162,142,164,138
23: 230,79,48,142,234,161,138,249,132,186
The results show that area 79 (East Village) is busiest in the early morning hours while area 237 (Upper East Side) is busiest mid-day and 161 (Manhattan Midtown) in the late afternoon and evening.
It would be simple to change the final processing to calculate the number of trips on a percentile basis or modify the above query find the potential maximum revenue.
Complete versions of the scripts can be downloaded here.