
Cryptocurrency has become a dominant force in the financial sector, offering a decentralized digital currency based on blockchain technology. When it comes to trading these cryptocurrencies, we need a cryptocurrency exchange. Binance is one of the largest cryptocurrency exchanges in the world, providing users with a secure and efficient way to trade cryptocurrencies.
In this article, let’s look at how to use the Binance API to query information about various cryptocurrencies and parse the data into a GridDB database.
Collecting Data from Binance
The first step would be to collect data from Binance. So we will be using the Binance API to connect and retrieve market information about cryptocurrencies. In this section, we will cover how to create an API key and retrieve data via the Binance API.
Creating the Binance API Key
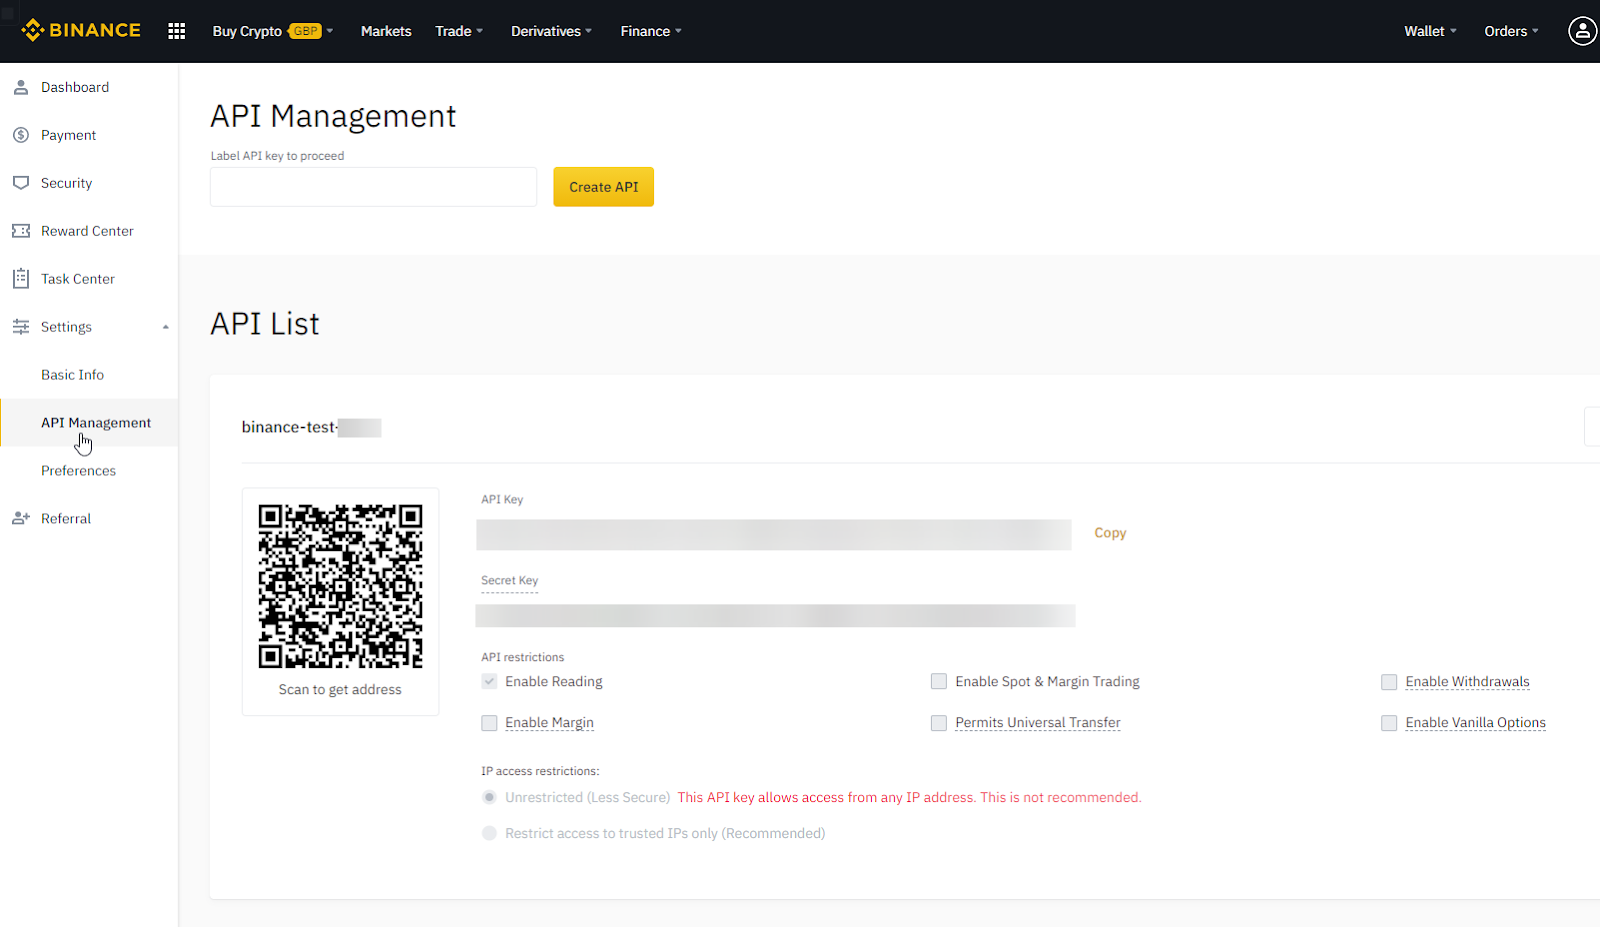
Any user with a Binance account can create an API key to utilize the Binance API. Navigate to account settings, then API Management, and create a new API Key in your Binance account. The user will have to provide a name for the API key and authenticate to generate an API key successfully.
Connecting to Binance API
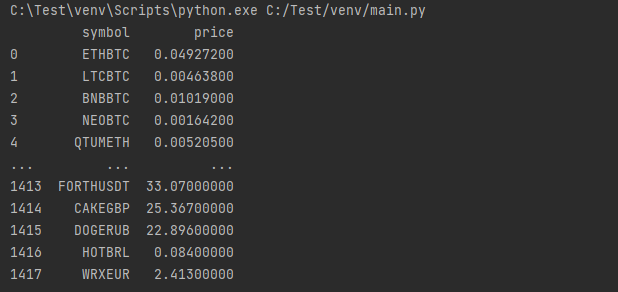
We will be using Python as the base programming language for this article since it offers a library called python-binance that can be used to establish connections to the Binance API easily. The following code block demonstrates how to connect and get the current price of all the cryptocurrencies available in Binance.
from binance.client import Client
import pandas as pd
import os

# Create the client
client = Client(os.environ['binance_api_key'], os.environ['binance_api_secret'])

# Retrieve all data
prices = client.get_all_tickers()

# Create a Pandas DataFrame
data = pd.DataFrame(prices)
print(data)
RESULT
Retrieving Data Periodically
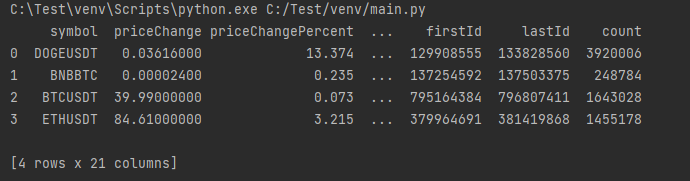
Let’s consider a scenario where a user is required to gather 24-hours market information of a selected set of cryptocurrencies at regular intervals. The below code block demonstrates how to achieve this functionality.
def retrive_market_data(currency_list):
    try:
        # Create the Connection
        client = Client(os.environ['binance_api_key'],
                        os.environ['binance_api_secret'])
        currency_data = []
        # Iterate the Currency List
        for currency in currency_list:
            # Get Crypto Information
            tickers = client.get_ticker(symbol=str(currency))
            currency_data.append(tickers)
        # Create a DataFrame
        currency_data_df = pd.DataFrame(currency_data)
        # Return the DataFrame
        return currency_data_df
    except BaseException as error:
        print(f"Error Occuered: {error}")


if __name__ == "__main__":
    list = ['DOGEUSDT','BNBBTC','BTCUSDT','ETHUSDT']
    print(retrive_market_data(list))
RESULT
Parsing Data to a GridDB Database
Now we have retrieved the data from the Binance API, and the next step would be to parse those data to a GridDB database. Let’s assume that we only require only the following information from the retrieved data set.
- symbol
- piceChange
- priceChangePercent
- weightedAvgPrice
- prevClosePrice
- lastPrice
- openPrice
- highPrice
- lowPrice
- volume
- openTime
- closeTime
We need to clean the retrieved data set before sending it to the database. This can be easily done by dropping the unnecessary columns from the Pandas DataFrame using the below code.
market_data.drop(columns=['lastQty','bidPrice','bidQty','askPrice','askQty', 'quoteVolume', 'firstId', 'lastId', 'count'],inplace=True)
Then we will need to convert the required fields into the necessary data types. As most values in this data set are float values, we will convert them from string to float while converting the “openTime” and “closeTime” values from Epoch to TimeStamp data type.
# Convert String to Float
market_data['priceChange'] = market_data['priceChange'].astype(float)
market_data['priceChangePercent'] = market_data['priceChangePercent'].astype(float)
market_data['weightedAvgPrice'] = market_data['weightedAvgPrice'].astype(float)
market_data['prevClosePrice'] = market_data['prevClosePrice'].astype(float)
market_data['lastPrice'] = market_data['lastPrice'].astype(float)
market_data['openPrice'] = market_data['openPrice'].astype(float)
market_data['highPrice'] = market_data['highPrice'].astype(float)
market_data['lowPrice'] = market_data['lowPrice'].astype(float)
market_data['volume'] = market_data['volume'].astype(float)

# Convert from Time since Epoch
market_data['openTime'] = pd.to_datetime(market_data['openTime'], unit='ms')
market_data['closeTime'] = pd.to_datetime(market_data['closeTime'], unit='ms')
Creating the GridDB Collection
Now we have transformed our data, and the next step will be to insert them into the GridDB database. However, before that, we need to create a proper container within the database to insert the data. For that, we can create a collection using the griddb_python library. The most important thing to keep in mind is that the data type should match both the Pandas DataFrame and the GridDB database, or else, it might cause errors.
import griddb_python as griddb

factory = griddb.StoreFactory.get_instance()
try:
    # Get GridStore object
    gridstore = factory.get_store(
        host='10.10.10.100',
        port=250,
        cluster_name='default',
        username='admin',
        password='admin'
    )

    # Create Collection
    containerName = "Crypto_Data_Container"
    crypto_container = griddb.ContainerInfo(containerName,
                    [["symbol", griddb.Type.STRING],
                     ["priceChange", griddb.Type.FLOAT],
                     ["priceChangePercent", griddb.Type.FLOAT],
                     ["weightedAvgPrice", griddb.Type.FLOAT],
                     ["prevClosePrice", griddb.Type.FLOAT],
                     ["lastPrice", griddb.Type.FLOAT],
                     ["openPrice", griddb.Type.FLOAT],
                     ["highPrice", griddb.Type.FLOAT],
                     ["lowPrice", griddb.Type.FLOAT],
                     ["volume", griddb.Type.FLOAT],
                     ["openTime", griddb.Type.TIMESTAMP],
                     ["closeTime", griddb.Type.TIMESTAMP]],
                    griddb.ContainerType.COLLECTION, True)

    data_container = gridstore.put_container(crypto_container)

except griddb.GSException as e:
    for i in range(e.get_error_stack_size()):
        print("[", i, "]")
        print(e.get_error_code(i))
        print(e.get_location(i))
        print(e.get_message(i))
The above code block demonstrates how to create a collection in GridDB using the griddb_python library.
Inserting Data Into the GridDB database.
Finally, we can pass the data retrieved from the Binance API to the GridDB collection. We now have a set of compatible data and database fields. The Pandas “marketdata” data frame contains the parsed data, and a GridDB collection is available to receive those data. GridDB provides us the ability to simply use the data frame itself to insert the data, and this functionality is demonstrated below;
def insert_data(binance_data):
    factory = griddb.StoreFactory.get_instance()
    try:
        # Get GridStore object
        gridstore = factory.get_store(
            host='10.10.10.100',
            port=250,
            cluster_name='default',
            username='admin',
            password='admin'
        )

        # Get the Collection
        containerName = "Crypto_Data_Container"
        data_container = gridstore.get_container(containerName)

        # Insert the DataFrame data
        data_container.put_rows(binance_data)

    except griddb.GSException as e:
        for i in range(e.get_error_stack_size()):
            print("[", i, "]")
            print(e.get_error_code(i))
            print(e.get_location(i))
            print(e.get_message(i))
That’s it, and now you have successfully obtained data from the Binance API and stored them in a GridDB database. We can use a cron job to run this program automatically if deployed on a server or use a scheduling service to execute the script periodically if deployed as a cloud function.
Visualizing Data
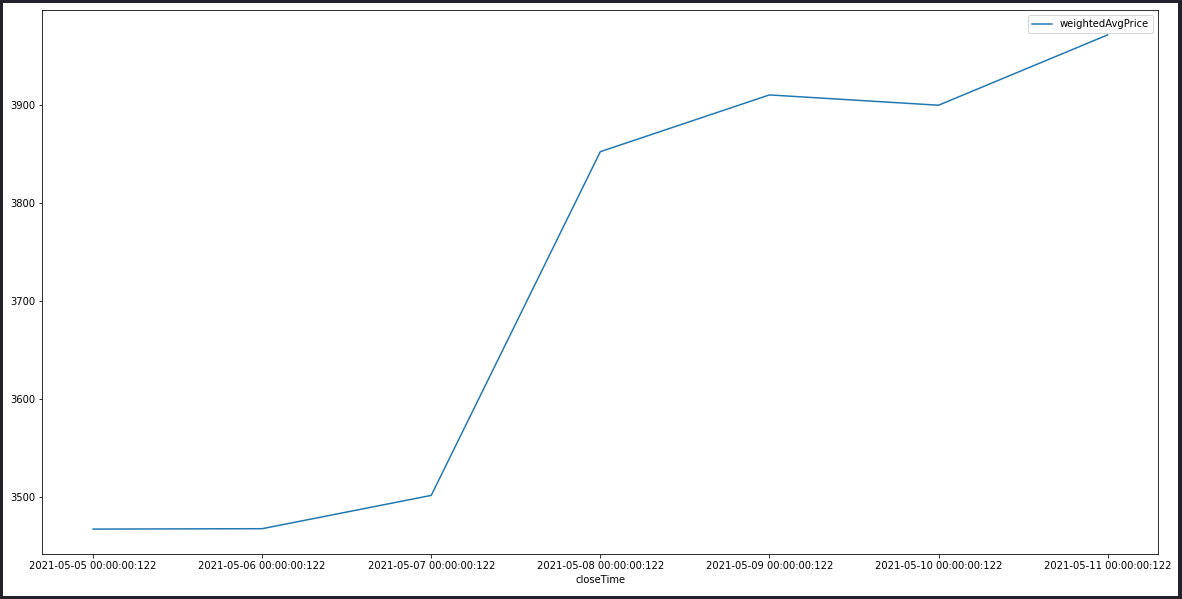
As we now know how to parse data, let’s try to extract meaningful information from the data set. Assume that we have run the above function every day for a week and we need to create a graph using the “weightedAvgPrice†to see the price action of the selected cryptocurrency. The following code block gets the data for ‘ETHUSDT’ by querying the GridDB database using a TQL statement and draw a lin chart using the resulting data set.
from binance.client import Client
import griddb_python as griddb
import pandas as pd

def get_data(symbol):
    factory = griddb.StoreFactory.get_instance()
    try:
        # Get GridStore object
        gridstore = factory.get_store(
            host='10.10.10.100',
            port=250,
            cluster_name='default',
            username='admin',
            password='admin'
        )

        # Get the Collection
        containerName = "Crypto_Data_Container"
        data_container = gridstore.get_container(containerName)

        # Fetch all rows - Crypto_Data_Container
        query_string = f"select symbol, weightedAvgPrice, closeTime where symbol = '{symbol}'"
        query = data_container.query(query_string)
        rs = query.fetch(False)

        # Create a List form the Crypto_Data_Container
        retrieved_data= []
        while rs.has_next():
            data = rs.next()
            retrieved_data.append(data)

        return retrieved_data

    except griddb.GSException as e:
        for i in range(e.get_error_stack_size()):
            print("[", i, "]")
            print(e.get_error_code(i))
            print(e.get_location(i))
            print(e.get_message(i))

if __name__ == "__main__":
    # Get the Necessary Data
    crypto_data = get_data('ETHUSDT')
    crypto_dataframe = pd.DataFrame(crypto_data, columns=['symbol', 'weightedAvgPrice', 'closeTime'])

    # Create the Plot using Pandas
    crypto_dataframe.sort_values('closeTime', ascending=True, inplace=True)
    lines = crypto_dataframe.plot.line(x='closeTime', y="weightedAvgPrice", figsize=(20, 10))
RESULT
Conclusion
In this article, we gained a general understanding of how to interact with an API and retrieve data, and then how to parse the retreived data into a database. When parsing the data, the most important factor is to clean up the required data and convert them into correct data types that the database would accept. Using these kinds of functionality, we can create automated data storage and analytics functions for any organization.