
As we are progressing towards a ‘smart’ world, we are neglecting the damage it is causing towards our natural phenomenon. One of the rising concerns among environmentalists is the change in the climate due to global warming. This climate change is traversing the effects on the animals and their habitats. Most of the animals adapt to these changes in climate by altering their features or by migrating to a different habitat.
Scientists from a prestigious university, LSU, gathered data from the Amazon rainforest over 40 years. They measured the size of wings and the masses of different species of birds, along with the climate change indicators, such as temperature and precipitation. Using the data of the temperature and precipitation of the recorded year as well as the year before against the mass and wing length of every bird.
Exporting and Import dataset using GridDB:
GridDB is a highly scalable and in-memory No SQL database that allows parallel processing for higher performance and efficiency. It is optimized for time-series databases for IoT and big data technologies. Using GridDB’s python client, we can easily connect GridDB to python and use it to import or export data in real-time.
Libraries:
We will be using some python libraries to preprocess and analyze the data visually.
- Pandas: Vastly used python library especially when dealing with data frames.
- Matplotlib: Primary library to present data visually using basic plots
- Seaborn: Advanced library to draw complex plots.
Preprocessing:

The dataset is now saved in the form of a data frame into the variable “data”.
The dataset contains a few columns that we would not be using in our analysis so we would be removing them from the data frame to minimize the memory consumption and maximize the time efficiency of our analysis.
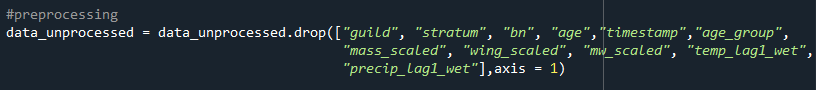
These are the columns remaining in the data frame that we would be using in our analysis:
- species: scientific name of the bird
- spMeanMass: mean mass for this species across this dataset
- spMeanWing: mean wing for this species across this dataset
- spMeanMW: mean of mass: wing ratio for this species across this dataset
- year: year of capture
- mass: bird mass (g)
- wing: wing chord length (mm)MWw: ratio of mass and wing measurements, if both available
- temp_lag0_dry: mean temperature (deg C) for the season of capture (dry season)
- temp_lag2_dry: mean temperature (deg C) for previous year’s dry season
- precip_lag0_dry: total precipitation (mm) for the season of capture (dry season)
- precip_lag2_dry: total precipitation (mm) for the previous year’s dry season
We will also need to introduce a primary key column that would help us with keeping track of each row individually. We will reset the index and rename it to ‘ID’.

Now we have completed our preprocessing and would save the data frame as CSV to export it to GridDB.

Exporting Dataset into GridDB:
Now we will upload the data to GridDB. For that, we will read the preprocessed CSV file using pandas and save it to the data frame.

Now, we will create a container to pass our column info to the GridDB to be able to generate the design of the database before inserting the row information.
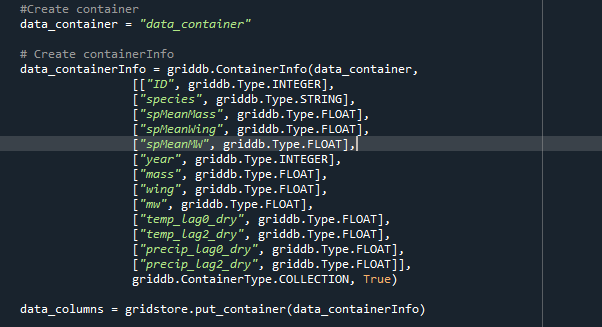
Now that our database design is constructed, we can easily insert our data into the GridDB.

Importing Dataset from GridDB:
We will use TQL to query the data from GridDB database that is similar to SQL commands. Before fetching the data, we would create the container to extract rows of data into, before saving it into a data frame.
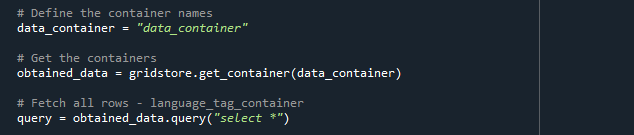
The next step would be to extract the rows in order of the column info and save it into a data frame to use for data visualization and analysis.
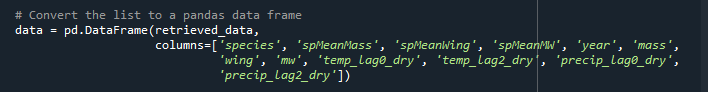
We now have our data saved into pandas data frame “data” and can continue to use it for our project.
Data Analysis and Visualization:
We will dig into the data and discover the pattern between the climate conditions and changes in birds’ features. The two climate conditions are:
- Temperature
- Precipitation
We will use the column ‘MW’ and use the ratio of mass to the wing length of the bird to determine how the features are altering.
Let’s start the analysis by first grouping the data into species and years to investigate how the mass-wing-length ratio changes over time for different species. We will group by the data frame using two columns, ‘year’ and ‘species’ by taking the mean of the rest of the columns.

We can dig further deep by visualizing the line plot of every species individually.
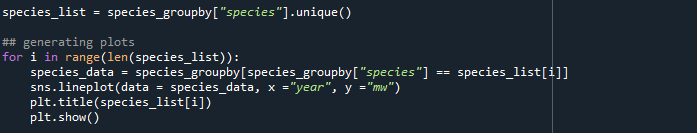
In most of the plots, the general trend is the same, mass to wing length ratio decreases with time, which means the mass decreases as the wing length increases with time. To understand this, here are a few of the plots from the above command.
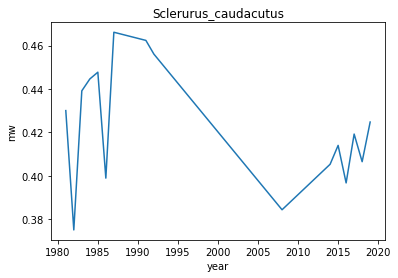
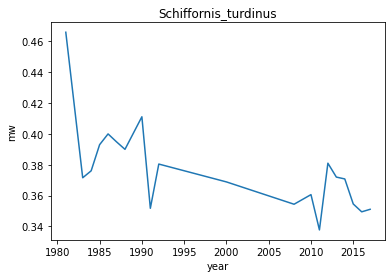
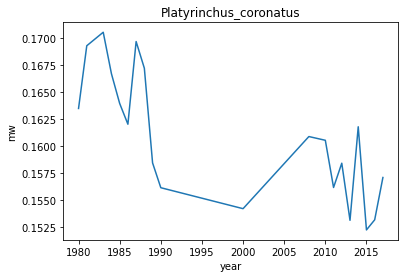
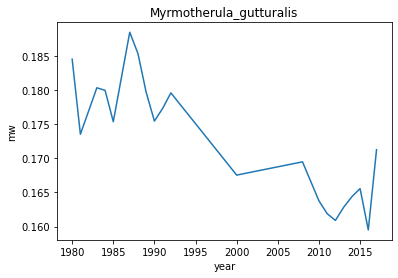
Figure 1-4: Species’ mass-wing length change over time
Now we will explore how the climate indicators are changing over time. For that, we will first group-by the data by year only. And then plot the graph of temperature against year and precipitation against year using the seaborn library.
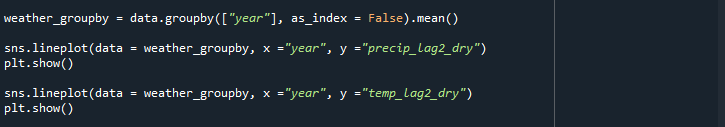
The following graphs are generated:
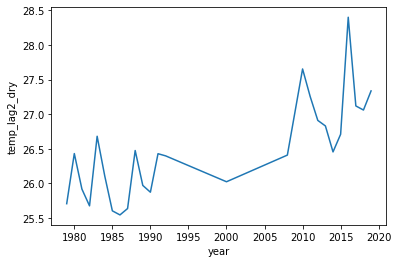
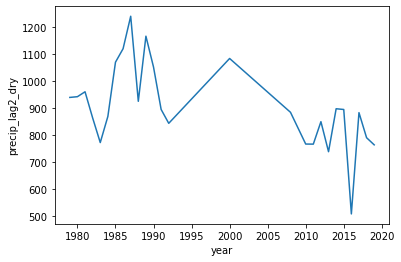
Figure 5 and 6: Climate indicators change over time
Conclusion:
We can conclude that as time is progressing, we are experiencing higher temperatures and lower precipitation due to which animals, including birds, are affected. The mass of the birds is decreasing while the wing length is increasing to adapt to the varying climate. All of the analysis was done using the GridDB database at the backend which made the integration seamless and efficient.
If you have any questions about the blog, please create a Stack Overflow post here https://stackoverflow.com/questions/ask?tags=griddb .
Make sure that you use the “griddb” tag so our engineers can quickly reply to your questions.