
Whenever we come across such articles, we instinctively feel that something doesn’t feel right. There are so many posts out there that it is nearly impossible to sort out the right from the wrong.
Fake news can be claimed in two ways: first, an argument against the facts. Secondly, the language used. The former can only be accomplished with automated query systems and substantial searches into the internet. The latter is possible through a natural language processing pipeline followed by a machine learning pipeline.
The purpose of this article is to model the news data labeled as fake or real. Using GridDB to extract the data, followed by performing the preprocess steps and finally building the machine learning model.
The outline of the tutorial is as follows:
- Dataset overview
- Importing required libraries
- Loading the dataset
- Data Cleaning and Preprocessing
- Building a Machine Learning Model
- Evaluating Model
- Conclusion
Prerequisites and Environment setup
This tutorial is carried out in Anaconda Navigator (Python version – 3.8.3) on Windows Operating System. The following packages need to be installed before you continue with the tutorial –
-
Pandas
-
NumPy
-
Scikit-learn
-
Matplotlib
-
Seaborn
-
Tensorflow
-
Keras
-
nltk
-
re
-
patoolib
-
urllib
-
griddb_python
You can install these packages in Conda’s virtual environment using conda install package-name. In case you are using Python directly via terminal/command prompt, pip install package-name will do the work.
GridDB Installation
While loading the dataset, this tutorial will cover two methods – Using GridDB as well as Using Pandas. To access GridDB using Python, the following packages also need to be installed beforehand:
- GridDB C-client
- SWIG (Simplified Wrapper and Interface Generator)
- GridDB Python Client
1. Dataset Overview
The dataset consists of about 40000 articles consisting around equal number of fake as well as real news Most of the news where collected from U.S newspapers and contain news about american politics, world news, news etc.
https://www.kaggle.com/datasets/clmentbisaillon/fake-and-real-news-dataset
2. Importing Required Libraries
#import griddb_python as griddb

import numpy as np
import pandas as pd
import matplotlib.pyplot as plt
import seaborn as sns

import urllib.request
import patoolib

import nltk
import string
from nltk.corpus import stopwords
import re

import tensorflow as tf
from keras.preprocessing.text import Tokenizer
from tensorflow.keras.utils import to_categorical
from keras.preprocessing.sequence import pad_sequences

from sklearn.metrics import classification_report,confusion_matrix,accuracy_score
from sklearn.model_selection import train_test_split

import warnings
warnings.filterwarnings('ignore')
%matplotlib inline
3. Loading the Dataset
Let’s proceed and load the dataset into our notebook.
3.a Using GridDB
Toshiba GridDB is a highly scalable NoSQL database best suited for IoT and Big Data. The foundation of GridDB’s principles is based upon offering a versatile data store that is optimized for IoT, provides high scalability, tuned for high performance, and ensures high reliability.
To store large amounts of data, a CSV file can be cumbersome. GridDB serves as a perfect alternative as it in open-source and a highly scalable database. GridDB is a scalable, in-memory, NoSQL database which makes it easier for you to store large amounts of data. If you are new to GridDB, a tutorial on reading and writing to GridDB can be useful.
Assuming that you have already set up your database, we will now write the SQL query in python to load our dataset.
factory = griddb.StoreFactory.get_instance()

# Initialize the GridDB container (enter your database credentials)
try:
    gridstore = factory.get_store(host=host_name, port=your_port,
            cluster_name=cluster_name, username=admin,
            password=admin)

    info = griddb.ContainerInfo("false_news",
                    [["title", griddb.Type.STRING],["text", griddb.Type.STRING],["subject", griddb.Type.STRING],
                     ["date", griddb.Type.TIMESTAMP],
                    griddb.ContainerType.COLLECTION, True)
    cont = gridstore.put_container(info)
    data = pd.read_csv("False.csv")
    #Add data
    for i in range(len(data)):
        ret = cont.put(data.iloc[i, :])
    print("Data added successfully")

try:
    gridstore = factory.get_store(host=host_name, port=your_port,
            cluster_name=cluster_name, username=admin,
            password=admin)

    info = griddb.ContainerInfo("true_news",
                    [["title", griddb.Type.STRING],["text", griddb.Type.STRING],["subject", griddb.Type.STRING],
                     ["date", griddb.Type.TIMESTAMP],
                    griddb.ContainerType.COLLECTION, True)
    cont = gridstore.put_container(info)
    data = pd.read_csv("True.csv")
    #Add data
    for i in range(len(data)):
        ret = cont.put(data.iloc[i, :])
    print("Data added successfully")
The read_sql_query function offered by the pandas library converts the data fetched into a panda data frame to make it easy for the user to work.
sql_statement1 = ('SELECT * FROM false_news')
false = pd.read_sql_query(sql_statement, cont)
sql_statement2 = ('SELECT * FROM true_news')
true = pd.read_sql_query(sql_statement, cont)Note that the cont variable has the container information where our data is stored. Replace the credit_card_dataset with the name of your container. More info can be found in this tutorial reading and writing to GridDB.
When it comes to IoT and Big Data use cases, GridDB clearly stands out among other databases in the Relational and NoSQL space. Overall, GridDB offers multiple reliability features for mission-critical applications that require high availability and data retention.
3.b Using pandas read_csv
We can also use Pandas’ read_csv function to load our data. Both of the above methods will lead to the same output as the data is loaded in the form of a pandas dataframe using either of the methods.
true = pd.read_csv("True.csv")
false = pd.read_csv("Fake.csv")
4. Data Cleaning and Preprocessing
true['label'] = 1
false['label'] = 0
Combining the two datasets into one and adding the columns text and title into one column.
news = pd.concat([true,false])
news['text'] = news['text'] + " " + news['title']
df=news.drop(["date","title","subject"],axis=1)
sns.countplot(x="label", data=news);
plt.show()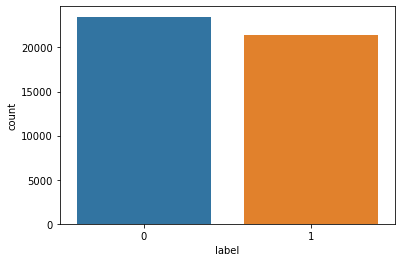
df.head()| text | label | |
|---|---|---|
| 0 | WASHINGTON (Reuters) – The head of a conservat… | 1 |
| 1 | WASHINGTON (Reuters) – Transgender people will… | 1 |
| 2 | WASHINGTON (Reuters) – The special counsel inv… | 1 |
| 3 | WASHINGTON (Reuters) – Trump campaign adviser … | 1 |
| 4 | SEATTLE/WASHINGTON (Reuters) – President Donal… | 1 |
We have to convert the raw messages (sequence of characters) into vectors (sequences of numbers).before that we need to do the following: Remove punctuation, Remove numbers. Remove tags, Remove urls, Remove stepwords, Change the news to lower case and Lemmatisation
The following 4 functions will help as to remove punctions (<,.”:, etc),numbers,tags and urls
def rem_punctuation(text):
  return text.translate(str.maketrans('','',string.punctuation))

def rem_numbers(text):
  return re.sub('[0-9]+','',text)


def rem_urls(text):
  return re.sub('https?:S+','',text)


def rem_tags(text):
  return re.sub('<.*?>'," ",text)

df['text'].apply(rem_urls)
df['text'].apply(rem_punctuation)
df['text'].apply(rem_tags)
df['text'].apply(rem_numbers)
0 WASHINGTON (Reuters) - The head of a conservat...
1 WASHINGTON (Reuters) - Transgender people will...
2 WASHINGTON (Reuters) - The special counsel inv...
3 WASHINGTON (Reuters) - Trump campaign adviser ...
4 SEATTLE/WASHINGTON (Reuters) - President Donal...
...
23476 st Century Wire says As WIRE reported earlier ...
23477 st Century Wire says It s a familiar theme. Wh...
23478 Patrick Henningsen st Century WireRemember wh...
23479 st Century Wire says Al Jazeera America will g...
23480 st Century Wire says As WIRE predicted in its ...
Name: text, Length: 44898, dtype: object
rem_stopwords() is the function for removing stopwords and for converting the words to lower case
stop = set(stopwords.words('english'))

def rem_stopwords(df_news):

    words = [ch for ch in df_news if ch not in stop]
    words= "".join(words).split()
    words= [words.lower() for words in df_news.split()]

    return words

df['text'].apply(rem_stopwords)
0 [washington, (reuters), -, the, head, of, a, c...
1 [washington, (reuters), -, transgender, people...
2 [washington, (reuters), -, the, special, couns...
3 [washington, (reuters), -, trump, campaign, ad...
4 [seattle/washington, (reuters), -, president, ...
...
23476 [21st, century, wire, says, as, 21wire, report...
23477 [21st, century, wire, says, it, s, a, familiar...
23478 [patrick, henningsen, 21st, century, wireremem...
23479 [21st, century, wire, says, al, jazeera, ameri...
23480 [21st, century, wire, says, as, 21wire, predic...
Name: text, Length: 44898, dtype: object
Lemmatization performs vocabulary and morphological analysis of the word and is normally aimed at removing inflectional endings only.That convert the words to their base or root form eg in “plays” it is converted to “play” by removing “s”
from nltk.stem import WordNetLemmatizer
#nltk.download('wordnet')
lemmatizer = WordNetLemmatizer()

def lemmatize_words(text):
  lemmas = []
  for word in text.split():
    lemmas.append(lemmatizer.lemmatize(word))
  return " ".join(lemmas)

df['text'].apply(lemmatize_words)
0 WASHINGTON (Reuters) - The head of a conservat...
1 WASHINGTON (Reuters) - Transgender people will...
2 WASHINGTON (Reuters) - The special counsel inv...
3 WASHINGTON (Reuters) - Trump campaign adviser ...
4 SEATTLE/WASHINGTON (Reuters) - President Donal...
...
23476 21st Century Wire say As 21WIRE reported earli...
23477 21st Century Wire say It s a familiar theme. W...
23478 Patrick Henningsen 21st Century WireRemember w...
23479 21st Century Wire say Al Jazeera America will ...
23480 21st Century Wire say As 21WIRE predicted in i...
Name: text, Length: 44898, dtype: object
Tokenizing & Padding
Tokenizing is the process of breaking down a text into words. Tokenization can happen on any character, however the most common way of tokenization is to do it on space character.
Padding Naturally, some of the sentences are longer or shorter. We need to have the inputs with the same size, for this we use padding
x = df['text'].values
y= df['label'].values
tokenizer = Tokenizer()
tokenizer.fit_on_texts(x)
word_to_index = tokenizer.word_index
x = tokenizer.texts_to_sequences(x)Lets keep all news to 250, add padding to news with less than 250 words and truncating long ones
vocab_size =  len(word_to_index)
oov_tok = "<oov>"
max_length = 250
embedding_dim = 100</oov>
x = pad_sequences(x, maxlen=max_length)5. Machine Learning Model Building
Vectorization Word vectorization is a methodology in NLP to map words or phrases from vocabulary to a corresponding vector of real numbers There are many method for doing vectorization including Bag of words,TFIDF or prettrained method such as Word2Vec ,Glove etc we are using GloVe learning algorithm for obtaining vector representations for words devolped by Stanford.
GloVe method is built on an important idea, You can derive semantic relationships between words from the co-occurrence matrix. Given a corpus having V words, the co-occurrence matrix X will be a V x V matrix, where the i th row and j th column of X, X_ij denotes how many times word i has co-occurred with word j.
The below code will download the pre-trained embeddings from the stanford website.
urllib.request.urlretrieve('https://nlp.stanford.edu/data/glove.6B.zip','glove.6B.zip')('glove.6B.zip', <http.client.HTTPMessage at 0x21bf8cb57c0>)
patoolib.extract_archive('glove.6B.zip')patool: Extracting glove.6B.zip ...
patool: ... glove.6B.zip extracted to `glove.6B' (multiple files in root).
'glove.6B'
embeddings_index = {};
with open('glove.6B/glove.6B.100d.txt', encoding='utf-8') as f:
    for line in f:
        values = line.split();
        word = values[0];
        coefs = np.asarray(values[1:], dtype='float32');
        embeddings_index[word] = coefs;

embeddings_matrix = np.zeros((vocab_size+1, embedding_dim));
for word, i in word_to_index.items():
    embedding_vector = embeddings_index.get(word);
    if embedding_vector is not None:
        embeddings_matrix[i] = embedding_vector;
After creating the embeddings dataset, we will split out dataset into train and test.
from sklearn.model_selection import train_test_split
X_train,X_test,y_train,y_test = train_test_split(x,y,test_size=0.20,random_state=1)
Building and training the LSTM model.
Things to note:
1) We have initialized the weights as the Glove embeddings matrix.
2) We are using 2 dropout layers with p=0.2
3) Optimizer used is Adam with metric to optimize on as accuracy since the dataset is balanced.
model = tf.keras.Sequential([
    tf.keras.layers.Embedding(vocab_size+1, embedding_dim, input_length=max_length, weights=[embeddings_matrix], trainable=False),
    tf.keras.layers.LSTM(64,return_sequences=True),
    tf.keras.layers.Dropout(0.2),
    tf.keras.layers.LSTM(32),
    tf.keras.layers.Dropout(0.2),
    tf.keras.layers.Dense(24, activation='relu'),
    tf.keras.layers.Dense(1, activation='sigmoid')
])
model.compile(loss='binary_crossentropy',optimizer='adam',metrics=['accuracy'])
model.summary()
Model: "sequential"
_________________________________________________________________
Layer (type) Output Shape Param #
=================================================================
embedding (Embedding) (None, 250, 100) 14770900
_________________________________________________________________
lstm (LSTM) (None, 250, 64) 42240
_________________________________________________________________
dropout (Dropout) (None, 250, 64) 0
_________________________________________________________________
lstm_1 (LSTM) (None, 32) 12416
_________________________________________________________________
dropout_1 (Dropout) (None, 32) 0
_________________________________________________________________
dense (Dense) (None, 24) 792
_________________________________________________________________
dense_1 (Dense) (None, 1) 25
=================================================================
Total params: 14,826,373
Trainable params: 55,473
Non-trainable params: 14,770,900
_________________________________________________________________
epochs = 6
history = model.fit(X_train,y_train,epochs=epochs,validation_data=(X_test,y_test),batch_size=128)
Epoch 1/6
281/281 [==============================] - 163s 570ms/step - loss: 0.1676 - accuracy: 0.9386 - val_loss: 0.0807 - val_accuracy: 0.9713
Epoch 2/6
281/281 [==============================] - 168s 599ms/step - loss: 0.0682 - accuracy: 0.9768 - val_loss: 0.0508 - val_accuracy: 0.9817
Epoch 3/6
281/281 [==============================] - 176s 625ms/step - loss: 0.0377 - accuracy: 0.9882 - val_loss: 0.0452 - val_accuracy: 0.9837
Epoch 4/6
281/281 [==============================] - 179s 638ms/step - loss: 0.0249 - accuracy: 0.9922 - val_loss: 0.0234 - val_accuracy: 0.9923
Epoch 5/6
281/281 [==============================] - 193s 689ms/step - loss: 0.0157 - accuracy: 0.9950 - val_loss: 0.0189 - val_accuracy: 0.9948
Epoch 6/6
281/281 [==============================] - 170s 605ms/step - loss: 0.0110 - accuracy: 0.9963 - val_loss: 0.0172 - val_accuracy: 0.9948
epochs = [i for i in range(6)]
fig , ax = plt.subplots(1,2)
train_acc = history.history['accuracy']
train_loss = history.history['loss']
val_acc = history.history['val_accuracy']
val_loss = history.history['val_loss']
fig.set_size_inches(20,10)

ax[0].plot(epochs , train_acc , 'go-' , label = 'Training Accuracy')
ax[0].plot(epochs , val_acc , 'ro-' , label = 'Testing Accuracy')
ax[0].set_title('Training & Testing Accuracy')
ax[0].legend()
ax[0].set_xlabel("Epochs")
ax[0].set_ylabel("Accuracy")

ax[1].plot(epochs , train_loss , 'go-' , label = 'Training Loss')
ax[1].plot(epochs , val_loss , 'ro-' , label = 'Testing Loss')
ax[1].set_title('Training & Testing Loss')
ax[1].legend()
ax[1].set_xlabel("Epochs")
ax[1].set_ylabel("Loss")
plt.show()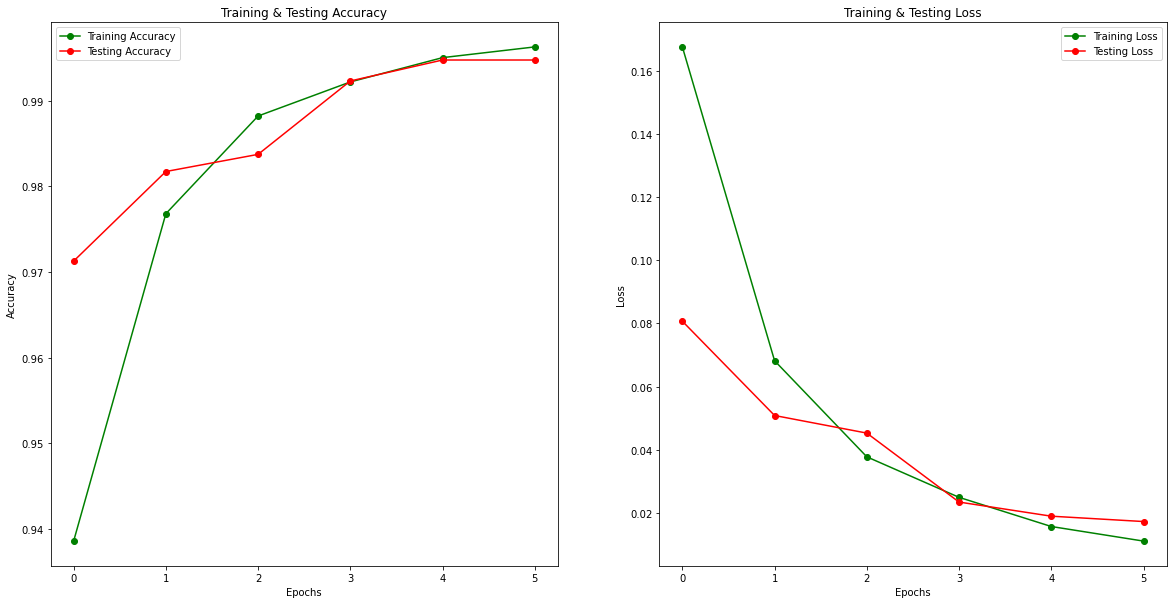
6. Evaluating Model
Our model is performing very well with 99.48% accuracy on the test dataset.
result = model.evaluate(X_test, y_test)
# extract those
loss = result[0]
accuracy = result[1]


print(f"[+] Accuracy: {accuracy*100:.2f}%")
281/281 [==============================] - 19s 69ms/step - loss: 0.0172 - accuracy: 0.9948
[+] Accuracy: 99.48%
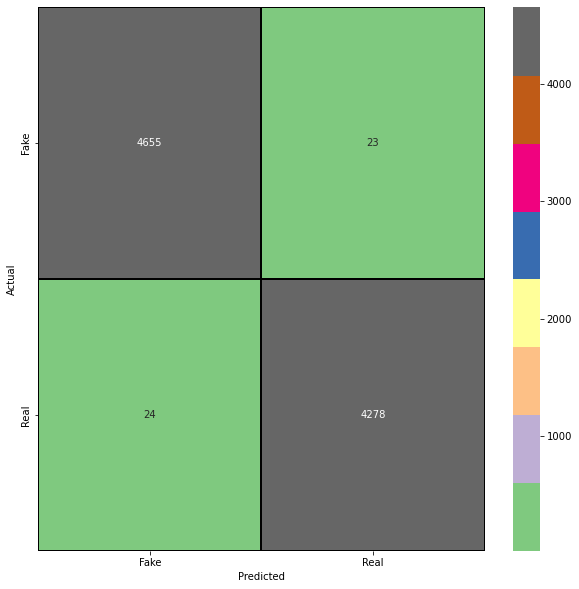
We will also create a confusion matrix to analyise precision and recall of our model on the test dataset. With this, we can gain greater insights on the false positives and false negatives of our model evaluations.
pred = model.predict_classes(X_test)
cm = confusion_matrix(y_test,pred)
cm = pd.DataFrame(cm , index = ['Fake','Real'] , columns = ['Fake','Real'])
plt.figure(figsize = (10,10))
sns.heatmap(cm,cmap= "Accent", linecolor = 'black' , linewidth = 1 , annot = True, fmt='' , xticklabels = ['Fake','Real'] , yticklabels = ['Fake','Real'])
plt.xlabel("Predicted")
plt.ylabel("Actual")Text(69.0, 0.5, 'Actual')
7. Conclusion
In this tutorial we built a very accurate fake news identifier model using NLP techniques and GridDB. We examined two ways to import our data, ussing (1) GridDB and (2) Pandas. For large datasets, GridDB provides an excellent alternative to import data in your notebook as it is open-source and highly scalable. Download GridDB today!