
Introduction:
BMI (Body mass index) is a ratio of body mass to height, used as a health indicator among many fitness trainers and health professionals. A person is classified into different categories, normal, overweight, obese, and extremely obese, according to their gender and BMI.
We will be using National Health and Nutrition Examination Survey (NHANES) data to relative different health indicators with BMI. The National Health and Nutrition Examination Survey (NHANES) data is a complex survey of tens of thousands of people designed to assess the health and nutritional status of adults and children in the United States. The NHANES data includes many measurements related to overall health, physical activity, diet, psychological health, socioeconomic factors, and more.
Exporting and Import dataset using GridDB:
We will be using GridDB to store a large amount of preprocessed data from NHANES. GridDB is a highly scalable and in-memory No SQL database that allows parallel processing for higher performance and efficiency. It is optimized for time-series databases for IoT and big data technologies. Using GridDB’s python client, we would be able to import or export data in real-time.
Setup GridDB:
First and foremost, we need to make sure that we have properly installed GridDB on our system. You can find the step-by-step guide to set up GridDB on different operating systems using this link.
Dataset:
NHANES has their built-in libraries available on python as well as R. we would be able to use the data by installing the NHANES library by running the following command on python or anaconda command prompt.

Next, you can import the library and save the data into any variable; in this case, “data_df”.

Along with the NHANES library, we would be using Pandas, Matplotlib, and Seaborn library to analyze and visualize the dataset.
Data Preprocessing:
NHANES dataset contains around 200 variables, containing information about diet and health conditions of the person. To make our analysis easier to understand and concentrated on conditions affecting BMI, we will filter out some columns that seem to be more important.
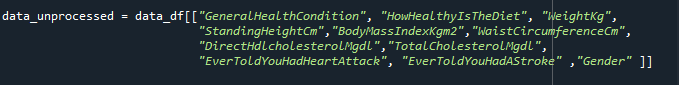
Lastly, we would drop the NULL columns and introduce the primary key column into our dataset:

To keep a local copy of the data, we can save it as a CSV file on our system before exporting it on GridDB.

Uploading the data to GridDB:
The standard approach set by GridDB to insert data is to create a container and use the put methods.
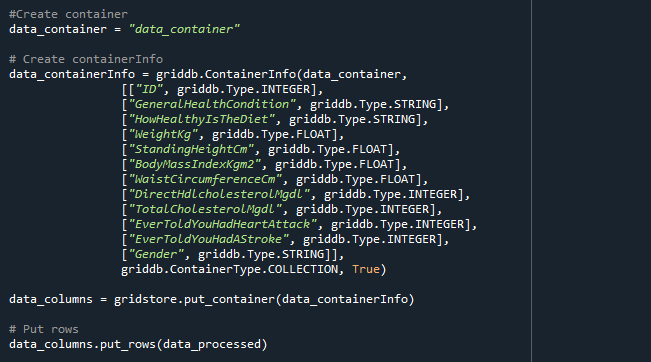
We have successfully exported the data to the GridDB cloud without any errors and can now access the data from anywhere using the GridDB interface.
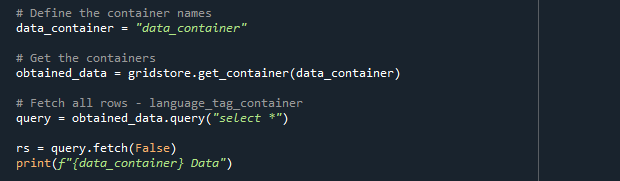
Accessing Data from GridDB:
To access the data from the GridDB cloud, we need to query out the database using TQL, GridDB’s query language. TQL uses similar commands to the standard SQL protocols to query data from the GridDB container.
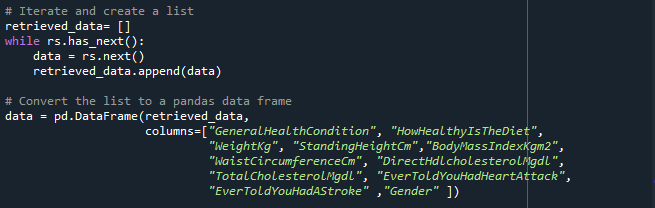
The next step would be to save the queried data into a dataframe to use for analysis. We achieve this using pd.DataFrame() method to convert the GridDB container lists to the data frame.
Analysis and Visualization:
Before starting the analysis, we will import some python libraries to help us in our project:
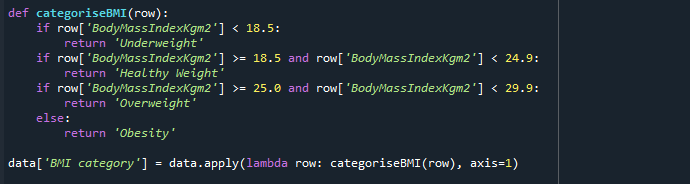
We will use a lambda method to apply the categorizeBMI function to our data and divide it into four levels; ‘Underweight’, ‘Healthy Weight’, ‘Overweight’, and ‘Obesity’
We would start by exploring the relationship between BMI and the gender of the person, to get an idea of how BMI varies among males and females.
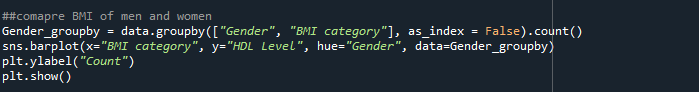
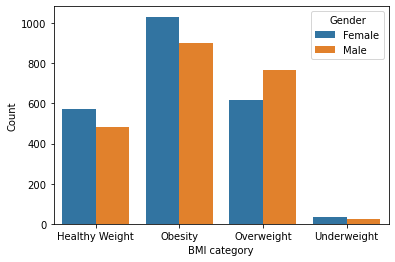
Figure 1 : Male and Females with different BMI levels
As the graph shows, although men are more likely to be overweight than women, women have higher chances of being obsessed.
One of our columns contains the HDL cholesterol level of the person. Normal HDL levels are above 40 according to CDC, so we will use this information to categorize the person into two categories; ‘Normal’ and ‘Dangerzone’.
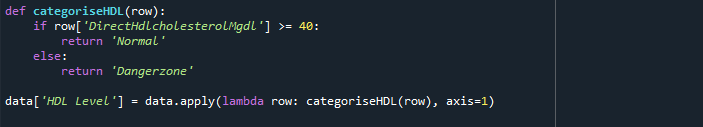
We will use HDL level and BMI category to divide the data into sections and examine how the BMI level affects the HDL level of a person.
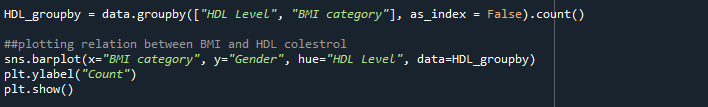
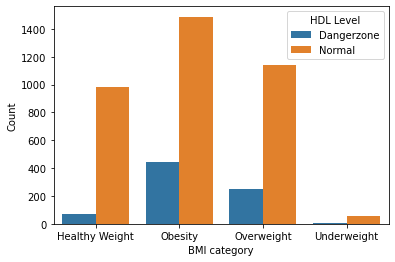
Figure 2:BMI categories in relation with HDL levels
We can see that a person is more likely to be in the danger zone when their BMI would be in the Obesity or Overweight range.
Similarly, we will use BMI levels to investigate their relationship with the diet taken by the person.
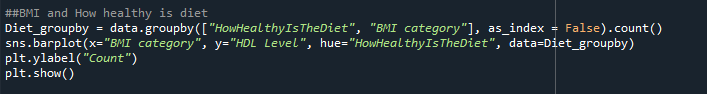
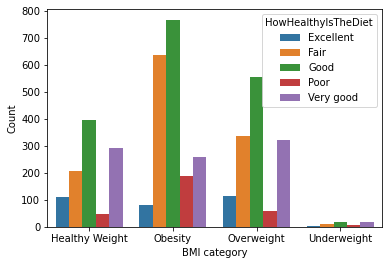
Figure 3: Diet effect on BMI category
It is evident by looking into the above graph that the highest number of people having poor or fair diet end up facing obesity, while most of the people having excellent diet have a healthy weight.
Lastly, but most important factor to compare with BMI is the chances of strokes or heart attack. For that, we will first filter out the people who had stroke or heart attack individually and then explore their BMI levels.
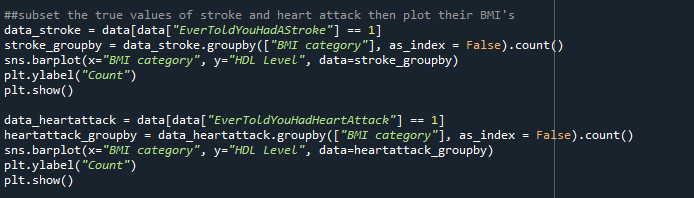
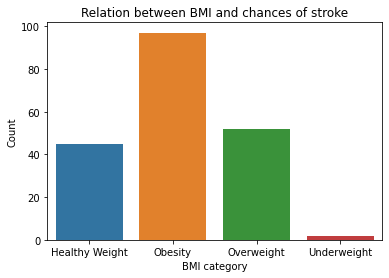
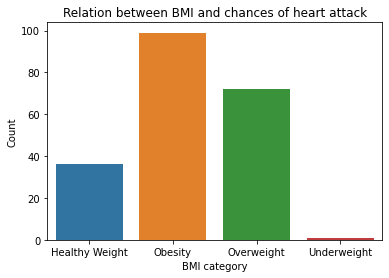
Figure 4 & 5: Relationship between Stroke/Heart Attack and BMI
As expected, the graph verifies our common concern that people dealing with obesity or overweight are more prone to having strokes or/and heart attacks.
Conclusion:
NHANES survey data aided us to conclude that BMI should be an important concern for people as it can be the reason for adverse health conditions. Similarly, the diet of the person is a major contributor to the BMI level of a person, and therefore, we should take care of our diet to live a healthy life. All of the analysis was done using the GridDB database at the backend, making the integration seamless and efficient.
If you have any questions about the blog, please create a Stack Overflow post here https://stackoverflow.com/questions/ask?tags=griddb .
Make sure that you use the “griddb” tag so our engineers can quickly reply to your questions.