
To improve a chart of time-series data we can let the user choose the time basis or “resolution” e.g. seconds, minutes, hours, etc.
This way, they can see look for micro-trends in the data (by using high resolution e.g. seconds) or look for broader macro-trends in the same data (by using low resolution, e.g. hours).
In this article, we’ll set up a time-series data visualization using Vue and Chart.js. We’ll allow a user to select different time resolutions which will be serviced by GridDB time sampling queries from a backend database.
This article is a continuation of a series where we’ve been building a server monitor dashboard using a Node Express backend with GridDB, and visualizing the data in Vue. It’s a good idea to read part one and part two first.
You can get the code for this tutorial here on GitHub.
Charting data with Vue Chartkick
The Vue app we built in the previous tutorial of this series used the VueChartJs library for data visualization.
Unfortunately, this library is not great when you need to continually update the data during the app lifecycle as we’ll be doing here.
A library that provides more flexibility in this regard is Vue Chartkick. So let’s replace the vue-chartjs script we’re loading in the document head with vue-chartkick.
index.html
<head>
  ...
  <script src="<https://cdn.jsdelivr.net/npm/vue-chartkick@0.6.1/dist/vue-chartkick.min.js>"></script>
</head>
Then we can make a minor modification to our Vue app so it uses the Chartkick line chart component instead of VueChartJs.
index.html
<div id="app">
  <line-chart v-if="serverData" :data="serverData"></line-chart>
</div>
<script type="text/javascript">
new Vue({
  el: "#app",
  data: () => ({
    serverData: []
  }),
  async mounted () {
    const res = await fetch("/data");
    this.serverData = await res.json();
  }
})
</script>
At this point, our Vue app should look the same as it did before, only now we’re using the more flexible Chartkick library.
Adding a resolution selector
Currently, our Vue app requests a time-series data payload from the server which always has the same time basis: seconds.
To allow a user to see the monitor on an hourly or minute basis instead, we’re going to add an HTML select element to our app template which will allow the user to select a different time basis.
Note that we have an option for a seconds, minutes, or hours time basis. Plus, we have a v-model bound to a variable resolution so that we can easily get the selected value in our Vue app.
index.html
<div id="app">
  <div>
    <line-chart v-if="serverData" :data="serverData"></line-chart>
    <select name="resolution" class="resolution-select" v-model="resolution">
      <option value="seconds">Seconds</option>
      <option value="minutes">Minutes</option>
            <option value="hours">Hours</option>
    </select>
  </div>
</div>
Let’s now add the new resolution reactive data property to the Vue instance and give it a default value of seconds.
index.html
new Vue({
  el: "#app",
  data: () => ({
    serverData: [],
    resolution: 'seconds'
  }),
  ...
})
We can also add some CSS to the document head to style the select little better,
<style>
  .resolution-select {
    margin: 2rem 0 0 1rem;
    padding: 0.5rem;
  }
</style>
With that done, we now see the selector below the chart.
Reloading data on select change
When the user selects a different resolution value, the Vue app should call the server for a new data payload. Currently, the data is only requested when the app is mounted.
To allow this, we’re going to create a method getServerData which will contain the logic for calling the server we had before.
We’re now going to call this method in the mounted hook, so we get data when the app is initialized. But we’ll also call it whenever the value of resolution changes. We can do this by using a watch function which is called whenever the reactive value changes.
index.html
new Vue({
  el: "#app",
  data: () => ({
    serverData: [],
    resolution: 'seconds'
  }),
  methods: {
    async getServerData() {
      const res = await fetch("/data");
      this.serverData = await res.json();
    }
  },
  watch: {
    resolution() {
      this.getServerData();
    }
  },
  mounted () {
    this.getServerData();
  }
})
Passing resolution value to the server
The next step is to pass the user’s chosen resolution to the server so that the server can return the correct data.
To do this, we’re going to change our fetch request to be a POST type and send the resolution value as part of a JSON payload in the request body. We can do this by passing a config object to the fetch API. This object will have a method of POST, a headers sub-object with Content-Type of application/json and a body property to which we create a JSON string containing the resolution value.
index.html
async getServerData() {
  const res = await fetch("/data", {
    method: 'POST',
    headers: {
      'Content-Type': 'application/json'
    },
    body: JSON.stringify({ resolution: this.resolution })
  });
  this.serverData = await res.json();
}
Handling POST with Express
Previously, our Express server was returning the time-series data when a GET request to /data was received.
Now, we want to use the POST verb so that we can receive the resolution parameter in a JSON payload. To allow for this, we’ll first add the JSON middleware to the Express server so it has this capability.
server.js
app.use(express.json());Next, we’ll change the GET /data route to POST /data. We’ll then be able to pass the resolution paramater, which will be a property of the req.body object, to getLatestRows. This is the method we created to query data from GridDB.
server.js
/* Before */
app.get('/data', async (req, res) => {
  const rows = await container.getLatestRows();
});

/* After */
app.post('/data', async (req, res) => {
  const rows = await container.getLatestRows(req.body.resolution);
  res.send(rows);
});
Time sampling queries
In the previous tutorial, we made it so that a snapshot of the server memory is taken every second the server is running.
The concept of the getLatestRows function is that we use a query to get the last 5 minutes of data and return that as an array.
db.js
const getLatestRows = (container) => async () => {
  try {
    const query = container.query("select * where timestamp > TIMESTAMPADD(MINUTE, NOW(), -5)");
    const rowset = await query.fetch();
    const data = [];
    while (rowset.hasNext()) {
      data.push(rowset.next());
    }
    return data;
  } catch(err) {
    console.log(err);
  }
}
Now we’re passing the resolution parameter to this function. We can use this to tell GridDB to get samples of the data on a minute or hour basis rather than just on a second basis.
To do this, we’re going to use GridDB’s TIME_SAMPLING function which will return averages of time-series data at a specified interval over a given range.
So let’s use TIME_SAMPLE in a select statement on our database. The first argument is the data we want sampled. In this case, that will be freeMemPercentage.
The second argument is the beginning of the range. The third argument is the end of the range. In this case, we want to begin an hour previous to the query, which we can do by subtracting 60 minutes from the current time, TIMESTAMPADD(MINUTE, NOW(), -60) and end at the current time, NOW().
The fourth argument is the interval you want to sample on and the fifth argument is the time basis. In this case, we’re taking samples every 1 minute. select TIME_SAMPLING(freeMemPercentage, TIMESTAMPADD(MINUTE, NOW(), -60), NOW(), 1, MINUTE)
Let’s now modify the getLatestRows function so that the query will be dependent on the resolution parameter we send. We’ll use a switch statement for this and use a query similar to the one above.
db.js
const getLatestRows = (container) => async (resolution) => {
try {
let tql;
switch(resolution) {
case 'hours':
tql = "select TIME_SAMPLING(freeMemPercentage, TIMESTAMPADD(HOUR, NOW(), -24), NOW(), 1, HOUR)"
break;
case 'minutes':
tql = "select TIME_SAMPLING(freeMemPercentage, TIMESTAMPADD(MINUTE, NOW(), -60), NOW(), 1, MINUTE)"
break;
default:
tql = "select TIME_SAMPLING(freeMemPercentage, TIMESTAMPADD(MINUTE, NOW(), -1), NOW(), 1, SECOND)"
}
const query = container.query(tql);
...
}
...
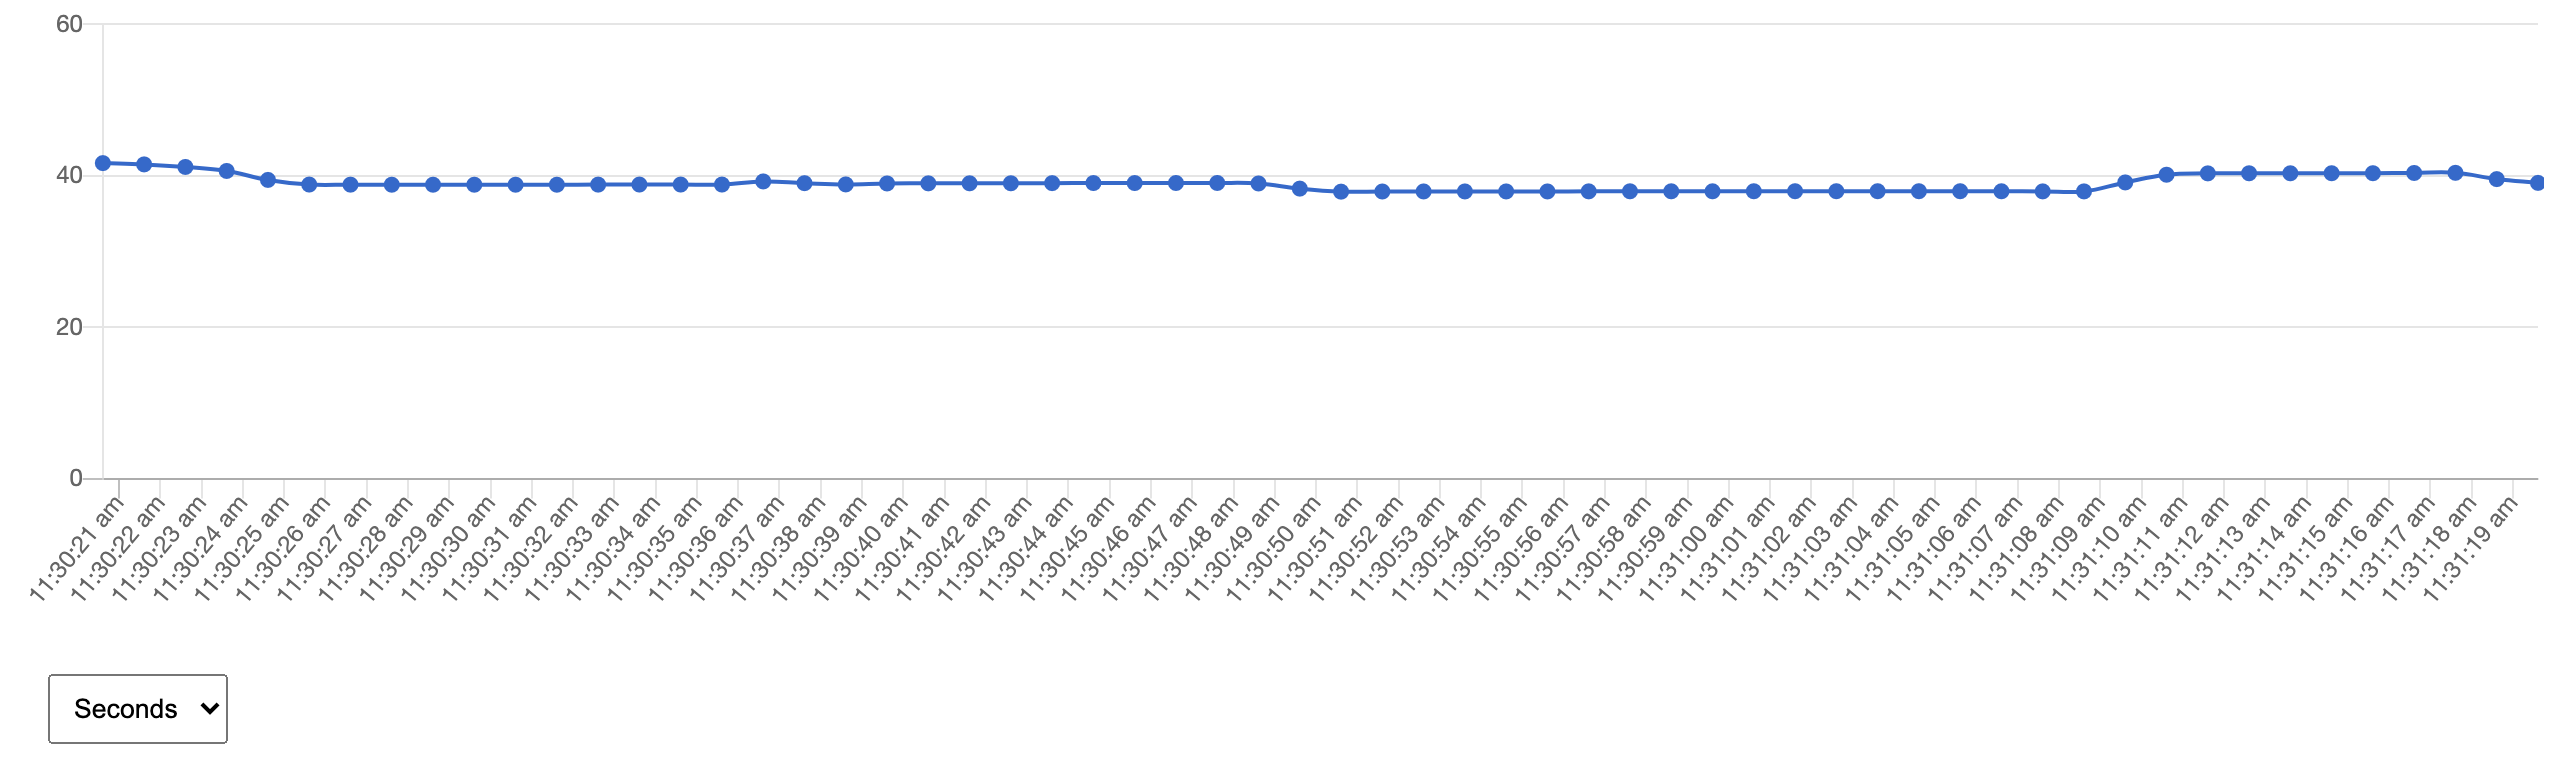
}With that done, GridDB will return data at the correct resolution. We can go and test this in the browser now.
Here’s what we see when selecting “seconds” as the time basis:
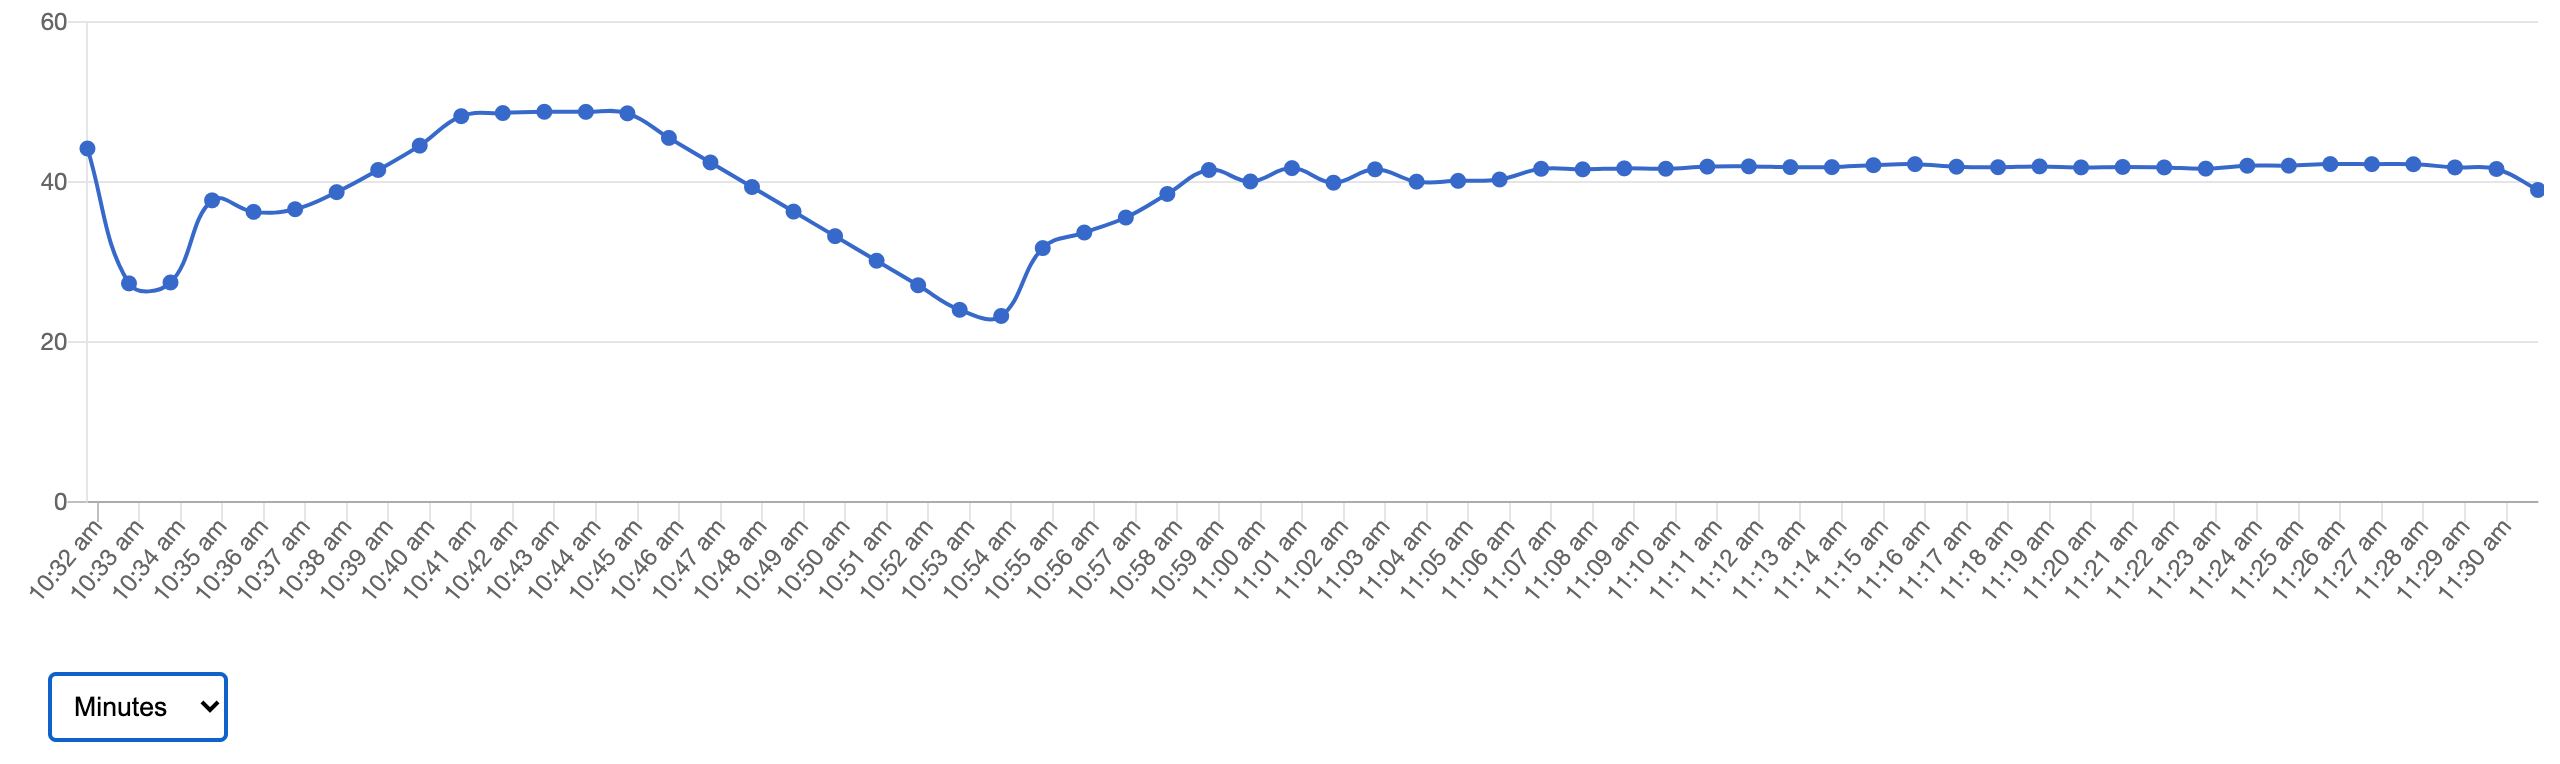
Here’s what we see when selecting “minutes”:
If you have any questions about the blog, please create a Stack Overflow post here https://stackoverflow.com/questions/ask?tags=griddb .
Make sure that you use the “griddb” tag so our engineers can quickly reply to your questions.