
Introduction: What is a Phishing Website?
Curiosity alone can lead to getting your personal information leaked to bad actors. Are you the type that just clicks on any link a friend sends to you? It’s dangerous! Hackers have so many ways of gathering information – they can gain your trust by social engineering and make you to do the things you would not do if it were just asked by a normal friend, and one of them is making you click on links.
Phishing is a great technique used by hackers to gather information: passwords, emails, name, etcetera. When the process is successful, it makes your device become vulnerable to exploits.
How is this done? As an example of somebody gaining access to your Facebook account: the hacker clones the page where Facebook asks you to change your password or the page that asks you to login. The hacker sets the backend to store anything you insert into a database they can access. When you change your password, you’re typing your old password as well as the new password. After some time gaining your trust, probably on WhatsApp, he uses a tool to make the link have the format of a normal Facebook link and sends it to you – the test case (with an intriguing caption). You click on the link, fill in your details and he gains access to them that way. The next time you login to Facebook, you would notice that you can’t access your account anymore. That’s how phishing works!
Manually Detecting a Hostile Website
Now, it is very imperative to have a method of detecting phishing websites. However, one might be safe by just being able to recognize phishing links. Below are flaws you can find in links to help you determine potentially fishy websites:
- The link is shortened
- The link is misspelled
- The link doesn’t have real characters (making use of Cyrillic letters)
- You have probably not heard of the website before or it ranks low
- It is very long, having a combination of legit and unoriginal links
So, if you get to the website, there are also some tips that would help you detect a phishing website.
- You notice that the right-click button of your mouse has been disabled on the website.
- Disabling the right-click button of your mouse prevents you from viewing page source.
- Pop-up windows can also be a way to detect a phishing website
Prerequisites
- Here are the required tools for this tutorial: I am on a CentOS computer
- Python 3.8 or Python 3.9. Get the latest version of Python from the website
- Jupyter Notebook (optional, if you already have the IDLE for Python). This is an environment used to write Python codes and it provides suitable cells where you can write code or text. You can get the Notebook by downloading Anaconda3 from https://www.anaconda.org, this will install some packages on your PC, including Jupyter Notebook and Spyder.
Data
The dataset we will be using for our model is the one provided by the University of California Irvine (UCI) here: the official dataset website. This contains many numeric features that will help us classify websites as being legit or fake.
The dataset has 2456 instances and 30 attributes as given. It’s always a good practice to check for missing values whenever we want to analyse data, but the website says there are no missing values. You can visit the UCI dataset page for it to download the dataset directly.
To understand all the features, download the Phishing Website Features.docx file from here.
Converting ARFF file to CSV
Since the dataset downloaded from the UCI website is an ARFF file, there’s a need to convert it into a CSV file so we can use it in our Python code. Make sure the arff dataset file you downloaded is in the same folder as the one containing your Python code.
import glob as gb # This builtin module would allow us to select only the file with .arff extension

files = [f for f in gb.glob("*.arff")] # We are using "files" because this selects all the files with that extension

# This function would convert the ARFF file to CSV file
def convert(lines):
    header = ""
    file_content = []
    data = not True

    for line in lines:
        if not data:
            if "@attribute" in line:
                attributes = line.split()
                columnName = attributes[attributes.index("@attribute")+1]
                header = header + columnName + ","
            elif "@data" in line:
                data = True
                header = header[:-1]
                header += "n"
                file_content.append(header)
        else:
            file_content.append(line)
    return file_content


for file in files:
    with open(file, "r") as inp:
        lines = inp.readlines()
        output = convert(lines)
        with open("dataset" + ".csv", "w") as out:
            out.writelines(output)
Using GridDB Python Client
Visit https://griddb.net/en/downloads/ to download GridDB Server and follow the installation instructions at the website to install it. Note that you can’t install Python’s GridDB Client without having SWIG and the C_Client installed. Visit here to download the version if you are on Windows or here to download the version for the available operating systems like CentOS and Ubuntu.
Before you can use the Python Client, you have to run the server in advance and you should get the host, port, cluster name and user name noted down because you would use them in your Python Client code.
If you’re using Jupyter notebook, you may need to follow the instructions here to get GridDB running on your notebook.
We would use GridDB as a container for our data, fill in the details of your GridDB server where you have empty quotes.
import griddb_python as griddb
factory = griddb.StoreFactory.get_instance()
your_host = ""
your_port = ""
your_cluster_name = ""
your_username = ""
your_password = ""
try:
    gridstore = factory.get_store(host=your_host, port=your_port,
            cluster_name=your_cluster_name, username=your_username,
            password=your_password)
conInfo = griddb.ContainerInfo("Phishing Websites",
                    [
                     ["having_IP_Address", griddb.Type.INTEGER],
                     ["URL_Length", griddb.Type.INTEGER],
                     ["Shortining_Service", griddb.Type.INTEGER],
                     ["having_At_Symbol", griddb.Type.INTEGER],
                     ["double_slash_redirecting", griddb.Type.INTEGER],
                     ["Prefix_Suffix", griddb.Type.INTEGER],
                     ["having_Sub_Domain", griddb.Type.INTEGER],
                     ["SSLfinal_State", griddb.Type.INTEGER],
                     ["Domain_registeration_length", griddb.Type.INTEGER],
                     ["Favicon", griddb.Type.INTEGER],
                     ["port", griddb.Type.INTEGER],
                     ["HTTPS_token", griddb.Type.INTEGER],
                     ["Request_URL", griddb.Type.INTEGER],
                     ["URL_of_Anchor", griddb.Type.INTEGER],
                     ["Links_in_tags", griddb.Type.INTEGER],
                     ["SFH", griddb.Type.INTEGER],
                     ["Submitting_to_email", griddb.Type.INTEGER],
                     ["Abnormal_URL", griddb.Type.INTEGER],
                     ["Redirect", griddb.Type.INTEGER],
                     ["on_mouseover", griddb.Type.INTEGER],
                     ["RightClick", griddb.Type.INTEGER],
                     ["popUpWidnow", griddb.Type.INTEGER],
                     ["Iframe", griddb.Type.INTEGER],
                     ["age_of_domain", griddb.Type.INTEGER],
                     ["DNSRecord", griddb.Type.INTEGER],
                     ["web_traffic", griddb.Type.INTEGER],
                     ["Page_Rank", griddb.Type.INTEGER],
                     ["Google_Index", griddb.Type.INTEGER],
                     ["Links_pointing_to_page", griddb.Type.INTEGER],
                     ["Statistical_report", griddb.Type.INTEGER],
                     ["Result", griddb.Type.INTEGER],
                    ],
                    griddb.ContainerType.COLLECTION, True)
    cont = gridstore.put_container(conInfo)
    data = pd.read_csv("dataset.csv")

    #Add data
    for i in range(len(data)):
        ret = cont.put(data.iloc[i, :])
    print("Successfully added the data")
except griddb.GSException as e:
    for i in range(e.get_error_stack_size()):
        print("[", i, "]")
        print(e.get_error_code(i))
        print(e.get_location(i))
        print(e.get_message(i))
import pandas as pd
dataset = pd.read_csv("dataset.csv")
Printing the head of the dataset (showing the top five records of the data)
A good thing to understand about the dataset is that all the features are numeric, so there is no need to encode the data. Also, the dataset has only three values – 1, -1 and 0; these are just the forms of representing booleans of the data. If the value is 1, then the condition (attribute/column name) is true for that feature; if the value is 0 or -1, it is false. Here is an instance, if there is a value of 1 under the popUpWindow column, it means that there was a popUpWindow. All these values determine what the result would be, the Result column also has 1 and -1 values which represent Phishing Website and Not a Phishing Website respectively.
Use print(dataset.head()) if you are using the Python IDLE
""" You can also decide to show the bottom five records of the data by
typing dataset.tail()"""
dataset.head()
dataset.shape # Number of rows and columns
(11055, 31)
dataset.describe() # Describing the data to gain insights from it
Building our Model to Predict the Results
This stage is where we build a model to predict if a website is a phishing website or not We would use a Decision Trees Classifier.
Building a Decision Tree Classifier model
The dataset has many columns but only the last column represents the result of the predictions if the values in all other columns are true. In other words, the last column depends on all other columns from the first to the penultimate column and it is called the Dependent Feature. All the other columns are called Independent Features. We are going to define two variables, X and y to store the values of the independent and dependent features respectively. So, X is referred to as the Independent Variable while y is the Dependent Variable.
The syntax for selecting the values is data.iloc[number_of_rows_to_select, number_of_columns_to_select].values. Since we are selecting all the rows, we would slice the dataset values from the first row to the last row using the slice operator : in Python; but for X, we only need all the columns except the last column (result) so we are going to slice, leaving out the last column. For y, we need the just the last column therefore no need for slicing.
X = dataset.iloc[:, :-1].values
y = dataset.iloc[:, -1].values
print(X)
[[-1  1  1 ...  1  1 -1]
 [ 1  1  1 ...  1  1  1]
 [ 1  0  1 ...  1  0 -1]
 ...
 [ 1 -1  1 ...  1  0  1]
 [-1 -1  1 ...  1  1  1]
 [-1 -1  1 ... -1  1 -1]]
print(y)
[-1 -1 -1 ... -1 -1 -1]
Splitting the dataset into Training Set and Test Set
from sklearn.model_selection import train_test_split as tts
X_train, X_test, y_train, y_test = tts(X, y, test_size=0.30, random_state=0)
We are training 70% of the data to predict the remaining 30% whether they are phishing websites or not. Thus, we are training approximately 1719 websites to predict approximately 739 websites, using Machine Learning.
Visualizing Data
GridDB also provides powerful Data Visualization, follow the instructions here to visualize the data using GridDB and Python’s matplotlib. Seaborn is used here and this takes a great deal of time to visualize because of the numerous attributes of the dataset.
import seaborn as sns
sns.pairplot(dataset)
<seaborn.axisgrid.PairGrid at 0xeced8d0>
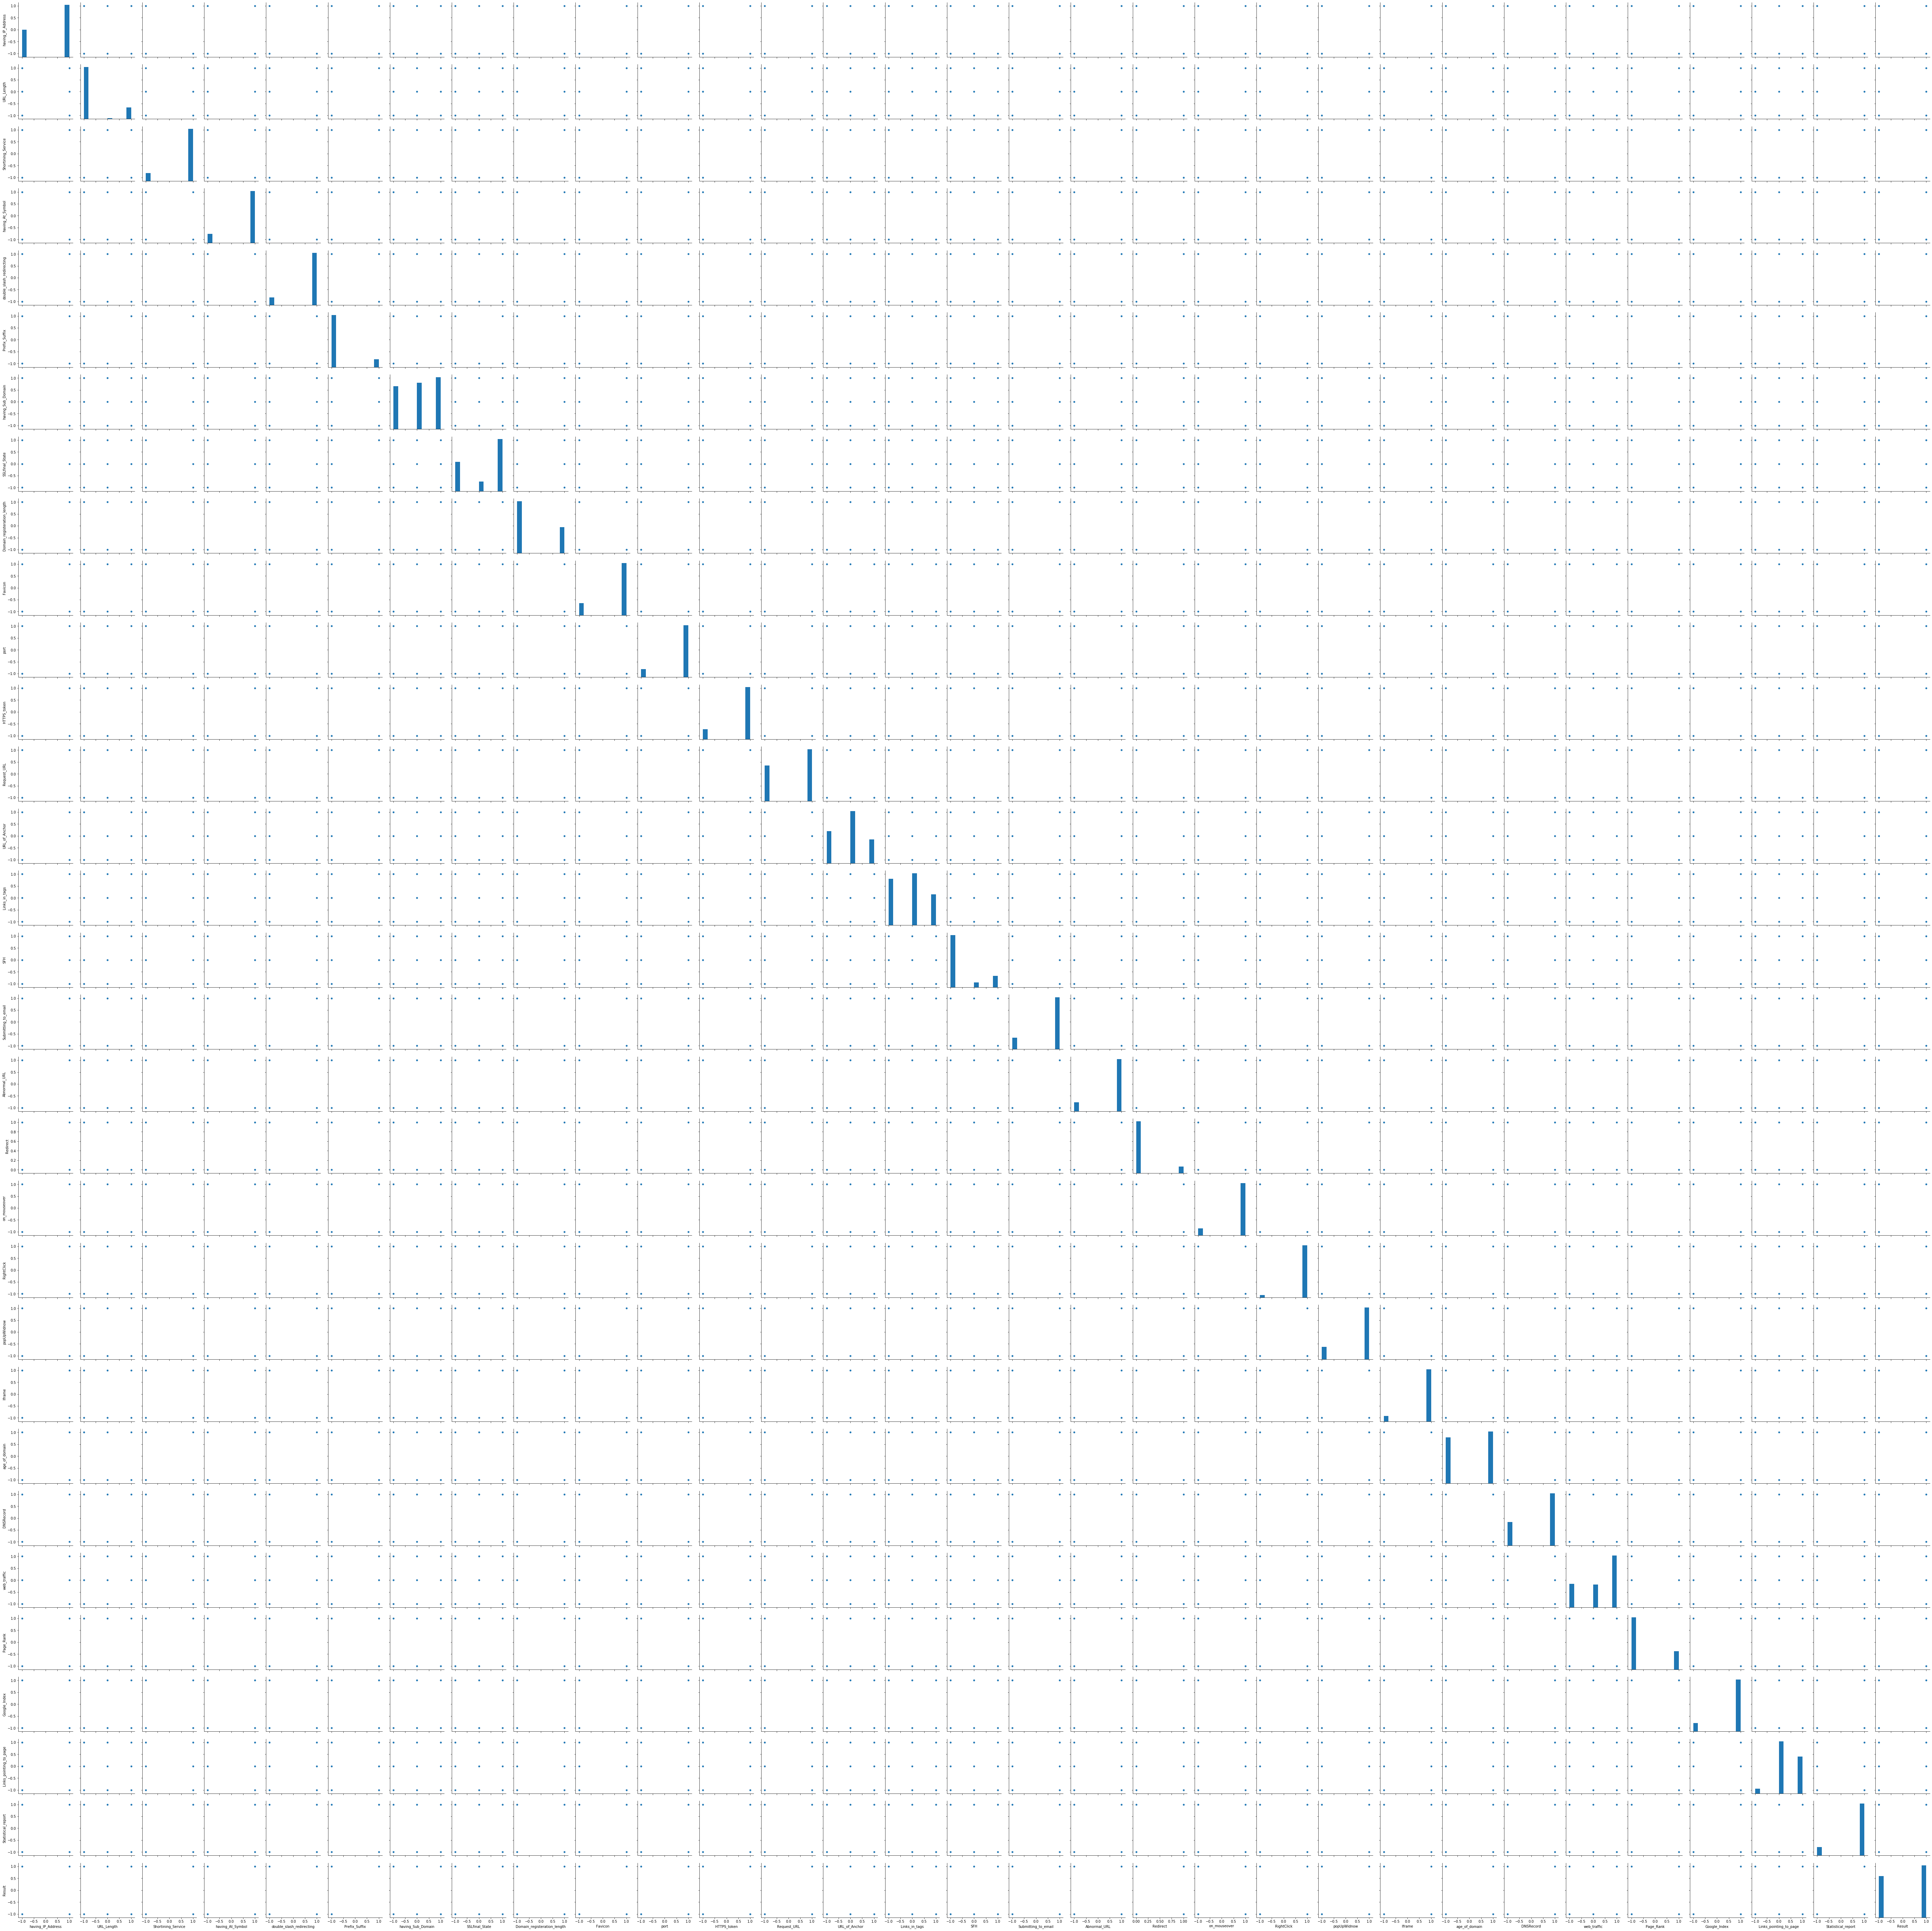
From the visualization above, we can observe that the age_of_domain column correlates with the Result column.
Building the model to classify whether a link is from a phishing website or not
from sklearn.tree import DecisionTreeClassifier
dtClassifier = DecisionTreeClassifier()
dtClassifier.fit(X_train, y_train)
DecisionTreeClassifier(class_weight=None, criterion='gini', max_depth=None,
                       max_features=None, max_leaf_nodes=None,
                       min_impurity_decrease=0.0, min_impurity_split=None,
                       min_samples_leaf=1, min_samples_split=2,
                       min_weight_fraction_leaf=0.0, presort=False,
                       random_state=None, splitter='best')
dty_pred = dtClassifier.predict(X_test)
print(dty_pred)
[-1 -1 -1 ... -1 1 1]
from sklearn.metrics import confusion_matrix
cMatrix = confusion_matrix(y_test, dty_pred)
print(cMatrix)
[[1426   72]
 [  48 1771]]
# Accuracy of the model
dtacc = dtClassifier.score(X_test, y_test)
dtacc *= 100
dtaccu = round(dtacc, 2)
dtaccuracy = str(dtaccu)+"%"
print(
f"""
The Accuracy of our model, using the Decision Tree Classifier
{dtaccuracy}
"""
)
The Accuracy of our model, using the Decision Tree Classifier
96.38%
Conclusion
An example of a good use for this model: you have a website url and fill in all the features of the website according to the dataset, except the last one; you then use the model to predict if it is a phishing website.
With the advent of this blog, we hope others will see that can be very good practice to use GridDB for Machine Learning.