Schema Overview
There are two components of this application that each have their own specific function. The data generating client creates one coffee chain that contains 3 coffee stores. Each of thesestores contain five coffee machines each. It then generates machine settings like cleaning and failure rates, as well as shot rates and standard deviations. The client preloads 3 days worth of data into GridDB based on the generated machine settings. It then starts generating records slowly, using the shot rate to determine the time span between each record, and inserts them to GridDB.
The data visualisation acts as an infinitely running web server that creates and updates plots on the web frontend. It uses periodic callbacks to fetch recent records and respond to user events. It uses TQL query to get either past or recent data and update the timeseries plots on the web page accordingly.
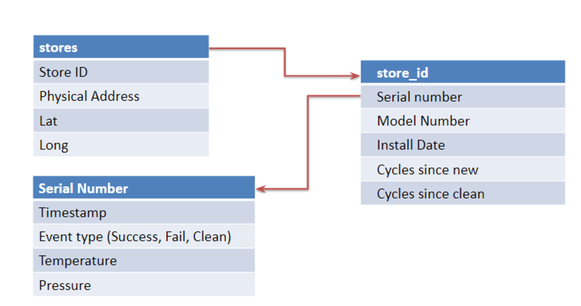
The flow of data begins with the coffee chain container. This collection can be thought of as the container that holds all the coffee stores in a franchise. Each store is identified by its store id. A coffee store also contains other information like an address and its geographic containers.
Every coffee store can then have one or more coffee machines. The coffee machine’s unique store id will also be the name of a container that holds information about its coffee machines. Each coffee machine has its own unique serial number. It also has its model number and installation date. There are also counts of how many cycles it has had since its last clean cycle and since it has been installed.
Every coffee machine can be thought of as a machine with an embedded GridDB C client. Every time it issues a shot or goes through a cycle it sends timestamp records to GridDB. The machine is represented as a coffee machine container that records the status of the cycle, (successful shot, failed shot, clean cycle) and the temperature and pressure of the shot.
Source Code
You can download the application and its source code for the data generating client and data visualisation component from the link below:
Download: datavisualisation_application.tar.gz