Fetching Past Data
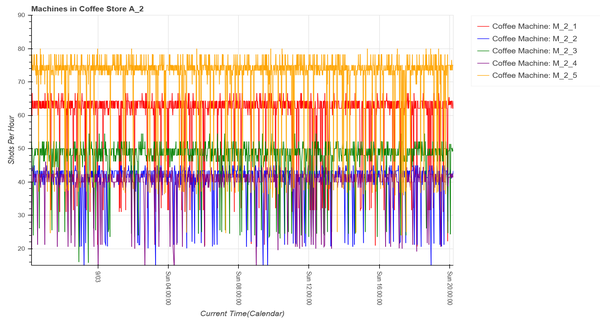
Shot Rates
To fetch and plot past shot rates we attach a callback function to the shot rate timeseries’ xrange.
Whenever the start, or beginning, of the range changes when the user pans left.
for index in range(len(line_sources)):
	timestamps = GridstoreMethods.fetch_timestamps_betw(gridstore, \
	serial_numbers[index],int(new),int(timestamp), filtered = True)

	get_past_readings(gridstore,line_sources[index],serial_numbers[index],\
	timestamps,SHOT_RATE)
For every line in the graph, we get all the timestamp records between (the new start ) and (the beginning of the line source). We also get the earliest date that is recorded and plotted on the graph. In other words, it fetches all the timestamp records needed to fill the gap in the plot. This is achieved in the
function fetch_timestamp_betw().
The
Fetching Past Data
Shot Rates
To fetch and plot past shot rates we attach a callback function to the shot rate timeseries’ xrange.
Whenever the start, or beginning, of the range changes when the user pans left.
for index in range(len(line_sources)):
	timestamps = GridstoreMethods.fetch_timestamps_betw(gridstore, \
	serial_numbers[index],int(new),int(timestamp), filtered = True)

	get_past_readings(gridstore,line_sources[index],serial_numbers[index],\
	timestamps,SHOT_RATE)
For every line in the graph, we get all the timestamp records between (the new start ) and (the beginning of the line source). We also get the earliest date that is recorded and plotted on the graph. In other words, it fetches all the timestamp records needed to fill the gap in the plot. This is achieved in the
function fetch_timestamp_betw().
The function issues a tql query for all the timestamp records between two timestamps where the
espresso shot was successful (event_type=1) and collects all the timestamps of
those row and puts in a list.
"select * where event_type=" + str(setting) + " and timestamp >= TO_TIMESTAMP_MS(" + str(start) +
") and timestamp <= TO_TIMESTAMP_MS(" + str(end) + ") order by timestamp desc"
From there it iterates through all the past timestamps and executes a function,
get_instantaneous_rate, to get the past instantaneous shot rate.
y_val = GridstoreMethods.get_instantaneous_rate(coffee_machine,timestamp)

def get_instantaneous_rate(coffee_machine,timestamp = griddb.Timestamp_current())
….
	pastql = "select * where event_type=1 AND timestamp < TO_TIMESTAMP_MS(“ +
	str(timestamp) + “) order by timestamp desc limit 1"

	past_timestamp = past_row.get_field_as_timestamp(0)
	delta = ( timestamp - past_timestamp ) / ( 1000 )
	rate = ( 1 / float(delta) ) * 3600
A way to estimate the shot rate with just two records is to calculate the timespan between them. You issue a tql query for a row that had a successful event and is before the timestamp. Then you retrieve the row and obtain its timestamp. From there you can get the difference between them in milliseconds and use conversion to get a shot rate from that.
Once you get the new shot rates and past timestamps, those data points are added to the line sources of the plot and then get updated on the next server callback.
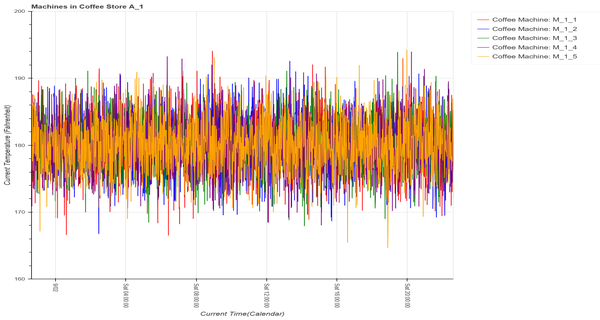
Past Temperatures
A very similar flow of events occurs for fetching past temperatures. A user pans left,
the new start from the xrange is extracted. A call to fetch_timestamps_betw
is made to get the timestamp records needed to fill the gap. From in get_past_readings()
the temperature corresponding to each timestamp record is found and the temperature field is extracted.
y_val = GridstoreMethods.get_recent_readings(gridstore,serial_numbers[index],\
int(timestamp))["temperature"]

tql = "select * where timestamp <= TO_TIMESTAMP_MS(“ + str(timestamp) +
“) order by timestamp desc limit 1"…...

temperature = row.get_field_as_float(2)
Source Code
You can download the application and its source code for the data generating client and data visualisation component from the link below:
Download: datavisualisation_application.tar.gz
ll the timestamp records between two timestamps where the esprFetching Past Data
Shot Rates
To fetch and plot past shot rates we attach a callback function to the shot rate timeseries’ xrange.
Whenever the start, or beginning, of the range changes when the user pans left.
for index in range(len(line_sources)):
	timestamps = GridstoreMethods.fetch_timestamps_betw(gridstore, \
	serial_numbers[index],int(new),int(timestamp), filtered = True)

	get_past_readings(gridstore,line_sources[index],serial_numbers[index],\
	timestamps,SHOT_RATE)
For every line in the graph, we get all the timestamp records between (the new start ) and (the beginning of the line source). We also get the earliest date that is recorded and plotted on the graph. In other words, it fetches all the timestamp records needed to fill the gap in the plot. This is achieved in the
function fetch_timestamp_betw().
The function issues a tql query for all the timestamp records between two timestamps where the
espresso shot was successful (event_type=1) and collects all the timestamps of
those row and puts in a list.
"select * where event_type=" + str(setting) + " and timestamp >= TO_TIMESTAMP_MS(" + str(start) +
") and timestamp <= TO_TIMESTAMP_MS(" + str(end) + ") order by timestamp desc"
From there it iterates through all the past timestamps and executes a function,
get_instantaneous_rate, to get the past instantaneous shot rate.
y_val = GridstoreMethods.get_instantaneous_rate(coffee_machine,timestamp)

def get_instantaneous_rate(coffee_machine,timestamp = griddb.Timestamp_current())
….
	pastql = "select * where event_type=1 AND timestamp < TO_TIMESTAMP_MS(“ +
	str(timestamp) + “) order by timestamp desc limit 1"

	past_timestamp = past_row.get_field_as_timestamp(0)
	delta = ( timestamp - past_timestamp ) / ( 1000 )
	rate = ( 1 / float(delta) ) * 3600
A way to estimate the shot rate with just two records is to calculate the timespan between them. You issue a tql query for a row that had a successful event and is before the timestamp. Then you retrieve the row and obtain its timestamp. From there you can get the difference between them in milliseconds and use conversion to get a shot rate from that.
Once you get the new shot rates and past timestamps, those data points are added to the line sources of the plot and then get updated on the next server callback.
Past Temperatures
A very similar flow of events occurs for fetching past temperatures. A user pans left,
the new start from the xrange is extracted. A call to fetch_timestamps_betw
is made to get the timestamp records needed to fill the gap. From in get_past_readings()
the temperature corresponding to each timestamp record is found and the temperature field is extracted.
y_val = GridstoreMethods.get_recent_readings(gridstore,serial_numbers[index],\
int(timestamp))["temperature"]

tql = "select * where timestamp <= TO_TIMESTAMP_MS(“ + str(timestamp) +
“) order by timestamp desc limit 1"…...

temperature = row.get_field_as_float(2)
Source Code
You can download the application and its source code for the data generating client and data visualisation component from the link below:
Download: datavisualisation_application.tar.gz
vent_type=1) and collects all the timestamps of thosFetching Past Data
Shot Rates
To fetch and plot past shot rates we attach a callback function to the shot rate timeseries’ xrange.
Whenever the start, or beginning, of the range changes when the user pans left.
for index in range(len(line_sources)):
	timestamps = GridstoreMethods.fetch_timestamps_betw(gridstore, \
	serial_numbers[index],int(new),int(timestamp), filtered = True)

	get_past_readings(gridstore,line_sources[index],serial_numbers[index],\
	timestamps,SHOT_RATE)
For every line in the graph, we get all the timestamp records between (the new start ) and (the beginning of the line source). We also get the earliest date that is recorded and plotted on the graph. In other words, it fetches all the timestamp records needed to fill the gap in the plot. This is achieved in the
function fetch_timestamp_betw().
The function issues a tql query for all the timestamp records between two timestamps where the
espresso shot was successful (event_type=1) and collects all the timestamps of
those row and puts in a list.
"select * where event_type=" + str(setting) + " and timestamp >= TO_TIMESTAMP_MS(" + str(start) +
") and timestamp <= TO_TIMESTAMP_MS(" + str(end) + ") order by timestamp desc"
From there it iterates through all the past timestamps and executes a function,
get_instantaneous_rate, to get the past instantaneous shot rate.
y_val = GridstoreMethods.get_instantaneous_rate(coffee_machine,timestamp)

def get_instantaneous_rate(coffee_machine,timestamp = griddb.Timestamp_current())
….
	pastql = "select * where event_type=1 AND timestamp < TO_TIMESTAMP_MS(“ +
	str(timestamp) + “) order by timestamp desc limit 1"

	past_timestamp = past_row.get_field_as_timestamp(0)
	delta = ( timestamp - past_timestamp ) / ( 1000 )
	rate = ( 1 / float(delta) ) * 3600
A way to estimate the shot rate with just two records is to calculate the timespan between them. You issue a tql query for a row that had a successful event and is before the timestamp. Then you retrieve the row and obtain its timestamp. From there you can get the difference between them in milliseconds and use conversion to get a shot rate from that.
Once you get the new shot rates and past timestamps, those data points are added to the line sources of the plot and then get updated on the next server callback.
Past Temperatures
A very similar flow of events occurs for fetching past temperatures. A user pans left,
the new start from the xrange is extracted. A call to fetch_timestamps_betw
is made to get the timestamp records needed to fill the gap. From in get_past_readings()
the temperature corresponding to each timestamp record is found and the temperature field is extracted.
y_val = GridstoreMethods.get_recent_readings(gridstore,serial_numbers[index],\
int(timestamp))["temperature"]

tql = "select * where timestamp <= TO_TIMESTAMP_MS(“ + str(timestamp) +
“) order by timestamp desc limit 1"…...

temperature = row.get_field_as_float(2)
Source Code
You can download the application and its source code for the data generating client and data visualisation component from the link below:
Download: datavisualisation_application.tar.gz
Fetching Past Data
Shot Rates
To fetch and plot past shot rates we attach a callback function to the shot rate timeseries’ xrange.
Whenever the start, or beginning, of the range changes when the user pans left.
for index in range(len(line_sources)):
	timestamps = GridstoreMethods.fetch_timestamps_betw(gridstore, \
	serial_numbers[index],int(new),int(timestamp), filtered = True)

	get_past_readings(gridstore,line_sources[index],serial_numbers[index],\
	timestamps,SHOT_RATE)
For every line in the graph, we get all the timestamp records between (the new start ) and (the beginning of the line source). We also get the earliest date that is recorded and plotted on the graph. In other words, it fetches all the timestamp records needed to fill the gap in the plot. This is achieved in the
function fetch_timestamp_betw().
The function issues a tql query for all the timestamp records between two timestamps where the
espresso shot was successful (event_type=1) and collects all the timestamps of
those row and puts in a list.
"select * where event_type=" + str(setting) + " and timestamp >= TO_TIMESTAMP_MS(" + str(start) +
") and timestamp <= TO_TIMESTAMP_MS(" + str(end) + ") order by timestamp desc"
From there it iterates through all the past timestamps and executes a function,
get_instantaneous_rate, to get the past instantaneous shot rate.
y_val = GridstoreMethods.get_instantaneous_rate(coffee_machine,timestamp)

def get_instantaneous_rate(coffee_machine,timestamp = griddb.Timestamp_current())
….
	pastql = "select * where event_type=1 AND timestamp < TO_TIMESTAMP_MS(“ +
	str(timestamp) + “) order by timestamp desc limit 1"

	past_timestamp = past_row.get_field_as_timestamp(0)
	delta = ( timestamp - past_timestamp ) / ( 1000 )
	rate = ( 1 / float(delta) ) * 3600
A way to estimate the shot rate with just two records is to calculate the timespan between them. You issue a tql query for a row that had a successful event and is before the timestamp. Then you retrieve the row and obtain its timestamp. From there you can get the difference between them in milliseconds and use conversion to get a shot rate from that.
Once you get the new shot rates and past timestamps, those data points are added to the line sources of the plot and then get updated on the next server callback.
Past Temperatures
A very similar flow of events occurs for fetching past temperatures. A user pans left,
the new start from the xrange is extracted. A call to fetch_timestamps_betw
is made to get the timestamp records needed to fill the gap. From in get_past_readings()
the temperature corresponding to each timestamp record is found and the temperature field is extracted.
y_val = GridstoreMethods.get_recent_readings(gridstore,serial_numbers[index],\
int(timestamp))["temperature"]

tql = "select * where timestamp <= TO_TIMESTAMP_MS(“ + str(timestamp) +
“) order by timestamp desc limit 1"…...

temperature = row.get_field_as_float(2)
Source Code
You can download the application and its source code for the data generating client and data visualisation component from the link below:
Download: datavisualisation_application.tar.gz