Updates and Responding to User Interactions
Updating with Real Time Data
The program will check the database for new records every 4 seconds and add them to the plot’s lines as they are added to GridDB.
for index in range(len(serial_numbers)):
	if len(line_sources[index].data["x"]) > 0:
			last_timestamp = line_sources[index].data["x"][-1]
			…. ## Perform Type checking
			new_rate_times = \
			GridstoreMethods.fetch_timestamps_betw(gridstore, \
			serial_numbers[index],last_timestamp,GridstoreMethods.Timestamp_current(),
			filtered = True)

			new_temperatures_times = \
			GridstoreMethods.fetch_timestamps_betw(gridstore,serial_numbers[index], \
			last_timestamp,GridstoreMethods.Timestamp_current())

	for idx in range(len(new_rate_times) -1 , -1, -1):
				new_avg = \
				GridstoreMethods.get_instantaneous_rate(coffee_machine,new_rate_times[idx])
				….
				line_sources[index].data["y"].append(new_avg)

	for idx in range(len(new_temperatures_times)-1, -1, -1):
			new_temperature =
			GridstoreMethods.get_recent_readings(gridstore,serial_numbers[index],
			int(new_temperatures_times[idx]))["temperature"]
			…
			temperature_sources[index].data["y"].append(new_temperature)
The program has a similar process to updating the graph with new data rows that were inserted from
GridDB. In this program the update callback functions executes every 4 seconds. In the callback function,
for every coffee machine in the coffee store, the average temperature readings are obtained.
It uses similar methods and process as it does for retrieving past data, get_instantaneous_rate
and get_recent_readings and fetch_timestamps_betw.
The timestamps records that are queried for are for rows that are up to the current time but are not in the data set of the timeseries lines. The program will get the last date for the line a coffee machine represents. The program will gather all the data for rows that are after that last date and retrieve the row fields needed to update each line in the graph. The updates are then rendered visually using a trigger function in Bokeh.
Switching Between Coffee Stores
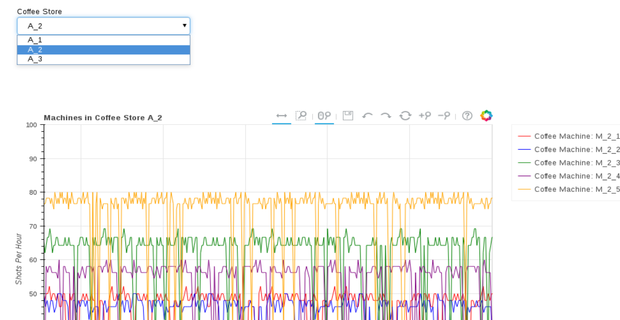
When the data visualisation component is loaded, data is shown for only one coffee store at a time. Users do have the ability to switch between coffee stores by selecting the store_id of it in the topmost dropdown option menu. When this happens, the current two plots are erased and redrawn to represent the data drawn from the coffee machines from the newly selected coffee store.
if selectedVal != select.value:
….
	selectedVal = select.value
	subLayouts.remove(timeseries)
	subLayouts.remove(temperature_timeseries)

	serial_numbers = filter(lambda serial_num: len(serial_num) > 0,
	GridstoreMethods.get_serial_nums(gridstore,str(selectedVal)))

	timeseries_plots, line_sources = \
	create_timeseries(gridstore,str(selectedVal),serial_numbers,xrangeCallback)
	temperature_plot, temperature_sources =

	create_temperature_plot(gridstore,str(selectedVal), \
	serial_numbers, findPreviousTemperatures)

	subLayouts.insert(2,timeseries_plots)
	subLayouts.insert(3,temperature_plot)
The program detects the user has changed to a new coffee store by responding to a change in the option menu.
From there it fetches the serial numbers for every coffee machine in that coffee store with get_serial_nums()
function. Now that it has the serial numbers to create the lines for timeseries plots, the graphs can be redrawn with
the create_timeseries and create_temperature_plot function and inserted back into the webpage’s
layout.
Source Code
You can download the application and its source code for the data generating client and data visualisation component from the link below:
Download: datavisualisation_application.tar.gz